. 2022 Jan;29(1):178-191.
doi: 10.1038/s41418-021-00848-2. Epub 2021 Aug 6.

CD63 acts as a functional marker in maintaining hematopoietic stem cell quiescence through supporting TGFβ signaling in mice

Affiliations

CD63 acts as a functional marker in maintaining hematopoietic stem cell quiescence through supporting TGFβ signaling in mice

Mengjia Hu et al. Cell Death Differ. 2022 Jan.

Abstract

Hematopoietic stem cell (HSC) fate is tightly controlled by various regulators, whereas the underlying mechanism has not been fully uncovered due to the high heterogeneity of these populations. In this study, we identify tetraspanin CD63 as a novel functional marker of HSCs in mice. We show that CD63 is unevenly expressed on the cell surface in HSC populations. Importantly, HSCs with high CD63 expression (CD63hi) are more quiescent and have more robust self-renewal and myeloid differentiation abilities than those with negative/low CD63 expression (CD63-/lo). On the other hand, using CD63 knockout mice, we find that loss of CD63 leads to reduced HSC numbers in the bone marrow. In addition, CD63-deficient HSCs exhibit impaired quiescence and long-term repopulating capacity, accompanied by increased sensitivity to irradiation and 5-fluorouracil treatment. Further investigations demonstrate that CD63 is required to sustain TGFβ signaling activity through its interaction with TGFβ receptors I and II, thereby playing an important role in regulating the quiescence of HSCs. Collectively, our data not only reveal a previously unrecognized role of CD63 but also provide us with new insights into HSC heterogeneity.


Conflict of interest statement

The authors declare no competing interests.

Figures
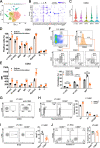
Fig. 1
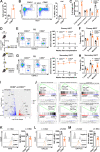
Fig. 1. CD63 is unevenly distributed on the cell surface in HSC populations and its high expression identifies more quiescent HSCs.
A Identification of 11 different cell clusters in HSPCs based on t-distributed stochastic neighbor embedding (t-SNE) analysis from published scRNA-seq data (GEO accession number: GSE90742). C1-C3, unprimed HSPC populations; Mk, megakaryocyte-primed progenitors; Er, erythrocyte-primed progenitors; Neu, neutrophile-primed progenitors; Mo1, type I macrophage-primed progenitors; Mo2, type II macrophage-primed progenitors; Ba, basophilia-primed progenitors; B, B cell-primed progenitors; T, T cell-primed progenitors. B Dot maps showing the differentially expressed genes in 11 identified clusters from Fig. 1A. C Violin plots showing the expression level of CD63 mRNA in purified LT-HSC, MPP1, MPP2, MPP3, and MPP4 (all these populations were combined within (A). D, E Flow cytometric analysis of surface and total (surface + intracellular) expression of CD63 in long-term HSCs (LT-HSCs; Lin- c-Kit+ Sca1+ CD34- Flk2-), short-term HSCs (ST-HSCs; Lin- c-Kit+ Sca1+ CD34+ Flk2-) and multipotent progenitors (MPPs; Lin- c-Kit+ Sca1+ CD34+ Flk2+), myeloid progenitors (MPs; Lin- c-Kit+ Sca1-), Lin- cells (Lineage-), myeloid cells (CD11b+ Gr-1+), B cells (B220+) and T cells (CD3e+) from the BM of normal mice (n = 6). The positive percentage and MFI of CD63 are shown in (D) and (E), respectively. Data are shown as the mean ± SD. **P < 0.01, ***P < 0.001. MFI, mean fluorescence intensity. F Flow cytometric analysis of the percentages of LT-HSCs, ST-HSCs, and MPPs in total, CD63- and CD63+ LSKs from the BM of normal mice by surface staining (n = 6). Representative flow cytometric plots are shown in the top panel. Data are shown as the mean ± SD. ***P < 0.001. ISO, isotype control. G Gating strategies used for subsequent flow cytometric analysis and sorting of CD63-/low (CD63-/lo) and CD63high (CD63hi) LT-HSCs. H Flow cytometric analysis of the cell cycle status of CD63-/lo and CD63hi LT-HSCs from the BM of normal mice (n = 6). Representative flow cytometric plots are shown in the left. Data are shown as the mean ± SD. ***P < 0.001. I Flow cytometric analysis of the in vivo BrdU incorporation of CD63-/lo and CD63hi LT-HSCs from the BM of normal mice (n = 6). Representative flow cytometric plots are shown in the left. Data are shown as the mean ± SD. ***P < 0.001. J Flow cytometric analysis of the apoptosis of CD63-/lo and CD63hi LT-HSCs from the BM of normal mice (n = 6). Representative flow cytometric plots are shown in the left. Data are shown as the mean ± SD.
Fig. 2
Fig. 2. CD63hi LT-HSCs display more robust self-renewal and myeloid differentiation ability.
A, B 1 × 103 CD63-/lo and CD63hi LT-HSCs sorted from the BM of normal mice were cultured in liquid medium for 10 days. A The total cell numbers in culture were counted (n = 4). Data are shown as the mean ± SD. ***P < 0.001. B The percentage of LSKs in culture was detected by flow cytometry (n = 4). Representative flow cytometric plots are shown in the left. Data are shown as the mean ± SD. ***P < 0.001. C Single CD63-/lo and CD63hi LT-HSC sorted from the BM of normal mice were cultured in methylcellulose medium for 14 days. The size distribution of 240 single-cell is shown (n = 4). Data are shown as the mean ± SD. ***P < 0.001. DH 3 × 102 CD63-/lo and CD63hi LT-HSCs, along with 5 × 105 CD45.1 BM helper cells, were transplanted into lethally irradiated CD45.1 mice. Sixteen weeks later, 1 × 106 BM cells from the primary recipient mice were transplanted into secondary CD45.1 recipient mice. D The strategy for HSC transplantation (HSCT). E, G The percentage of donor-derived cells in the peripheral blood (PB) of (E) primary and (G) secondary recipients was measured at the indicated time by flow cytometry (n = 6). Representative flow cytometric plots of 16 weeks after primary and secondary transplantation are shown in the left. Data are shown as the mean ± SD. ***P < 0.001. F, H The lineage distribution of donor-derived cells in the PB of (F) primary and (H) secondary recipients at 16 weeks after transplantation was determined by flow cytometry (n = 6). Data are shown as the mean ± SD. *P < 0.05, **P < 0.01, ***P < 0.001. I, J CD63-/lo and CD63hi LT-HSCs sorted from the BM of normal mice were subjected to RNA-seq analysis (n = 3). I Volcano plot showing the differentially expressed genes (DEGs) between CD63-/lo and CD63hi LT-HSCs. DEGs were identified using the combined criteria |log2 fold change| > 1 and q-value < 0.05. Representative myeloid- and lymphoid-specific DEGs are indicated. J Gene set enrichment analysis (GSEA) of the RNA-seq data. GSEA plots of HSC signature, quiescence, long-term, proliferation, cell cycle, and DNA duplication are shown. NES, normalized enrichment scores; FDR, false discovery rates. K Flow cytometric analysis of mitochondrial mass in CD63-/lo and CD63hi LT-HSCs from the BM of normal mice by MitoTracker Green (MTG) staining (n = 5). Representative flow cytometric plots are shown in the left. Data are shown as the mean ± SD. ***P < 0.001. L Flow cytometric analysis of mitochondrial membrane potential in CD63-/lo and CD63hi LT-HSCs from the BM of normal mice by DilC1(5) staining (n = 5). Representative flow cytometric plots are shown in the left. Data are shown as the mean ± SD. ***P < 0.001. M Flow cytometric analysis of O-propargyl-puromycin (OP-Puro) incorporation in CD63-/lo and CD63hi LT-HSCs from the BM of normal mice (n = 5). Representative flow cytometric plots are shown in the left. Data are shown as the mean ± SD. ***P < 0.001.
Fig. 3
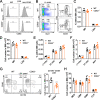
Fig. 3. Knockout of CD63 results in a reduced number of HSCs in mice.
A Flow cytometric analysis of cell surface expression of CD63 in LSKs from the BM of WT and CD63−/− mice. Representative flow cytometric plots of four biological replicates are shown. B Representative flow cytometric plots showing the percentage of HSPCs in the BM of WT and CD63−/− mice. C, D The (C) percentages and (D) absolute numbers (one leg) of LSKs and MPs in the BM of WT and CD63−/− mice (n = 6). Data are shown as the mean ± SD. E, F The (E) percentages and (F) absolute numbers (one leg) of LT-HSCs, ST-HSCs, and MPPs in the BM of WT and CD63−/− mice (n = 6). Data are shown as the mean ± SD. **P < 0.01, ***P < 0.001. G The absolute number (one leg) of CD150+ CD48- LSKs in the BM of WT and CD63−/− mice (n = 6). Representative flow cytometric plots are shown in the left. Data are shown as the mean ± SD. ***P < 0.001. H The absolute numbers (one leg) of granulocyte monocyte progenitors (GMPs; Lin- c-Kit+ Sca1- CD127- CD16/32+ CD34+), common myeloid progenitors (CMPs; Lin- c-Kit+ Sca1- CD127- CD16/32- CD34+), megakaryocyte erythroid progenitors (MEPs; Lin- c-Kit+ Sca1- CD127- CD16/32- CD34-) and common lymphoid progenitors (CLPs; Lin- CD127+ c-Kitlow Sca1low) in the BM of WT and CD63−/− mice (n = 6). Data are shown as the mean ± SD.
Fig. 4
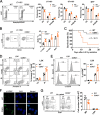
Fig. 4. Deletion of CD63 leads to impairment of HSC quiescence.
A Flow cytometric analysis of the cell cycle status of LT-HSCs, ST-HSCs and MPPs from the BM of WT and CD63−/− mice (n = 6). Representative flow cytometric plots for LT-HSCs are shown in the left. Data are shown as the mean ± SD. *P < 0.05, **P < 0.01, ***P < 0.001. (B) Flow cytometric analysis of the in vivo BrdU incorporation of LT-HSCs, ST-HSCs, and MPPs from the BM of WT and CD63−/− mice (n = 6). Representative flow cytometric plots for LT-HSCs are shown in the left. Data are shown as the mean ± SD. **P < 0.01, ***P < 0.001. C The survival rates of WT and CD63−/− mice after a single dose of 6.5 Gy TBI (n = 10). Kaplan–Meier survival curves and log-rank test were used to analyze the survival rates of mice. **P < 0.01. D Flow cytometric analysis of the apoptosis of LSKs from the BM of WT and CD63−/− mice during steady-state or 12 h after a single dose of 6.0 Gy TBI (n = 5). Representative flow cytometric plots are shown in the left. Data are shown as the mean ± SD. ***P < 0.001. Ctl, control; IR, irradiation. E Flow cytometric analysis of γ-H2AXS139 expression in LSKs from the BM of WT and CD63−/− mice during steady-state or 2 h after a single dose of 2.0 Gy TBI (n = 5). Data are shown as the mean ± SD. ***P < 0.001. F Immunofluorescence analysis of γ-H2AXS139 expression in LSKs freshly sorted from the BM of WT and CD63−/− mice 2 h after a single dose of 2.0 Gy TBI. Representative immunofluorescence images of three biological replicates are shown. The scale bar indicates 10 μm. G The absolute numbers (one leg) of LSKs and MPs in the BM of WT and CD63−/− mice 15 days after 5.0 Gy TBI (n = 6). Representative flow cytometric plots are shown in the left. Data are shown as the mean ± SD. ***P < 0.001.
Fig. 5
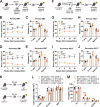
Fig. 5. Loss of CD63 compromises the long-term repopulating ability of HSCs.
AE 5 × 105 BM cells from WT or CD63−/− mice (CD45.2) were mixed with CD45.1 competitive BM cells (at the ratio of 1:1) and then were transplanted into lethally irradiated CD45.1 mice. Sixteen weeks later, 1 × 106 BM cells from the primary recipient mice were transplanted into secondary CD45.1 recipient mice. A The strategy for competitive BM transplantation (BMT). B, D The percentage of donor-derived cells in the PB of (B) primary and (D) secondary recipients was measured at the indicated time by flow cytometry (n = 6). Data are shown as the mean ± SD. ***P < 0.001. C, E The lineage distribution of donor-derived cells in the PB of (C) primary and (E) secondary recipients at 16 weeks after transplantation was determined by flow cytometry (n = 6). Data are shown as the mean ± SD. **P < 0.01. FJ 3 × 102 WT or CD63−/− LT-HSCs (CD45.2), along with 5 × 105 CD45.1 BM helper cells, were transplanted into lethally irradiated CD45.1 mice. Sixteen weeks later, 1 × 106 BM cells from the primary recipient mice were transplanted into secondary CD45.1 recipient mice. F The strategy for HSC transplantation (HSCT). G, I The percentage of donor-derived cells in the PB of (G) primary and (I) secondary recipients was measured at the indicated time by flow cytometry (n = 6). Data are shown as the mean ± SD. ***P < 0.001. H, J The lineage distribution of donor-derived cells in the PB of (H) primary and (J) secondary recipients at 16 weeks after transplantation was determined by flow cytometry (n = 6). Data are shown as the mean ± SD. **P < 0.01, ***P < 0.001. KM 1 × 106 BM cells from WT or CD63−/− mice (CD45.2) were transplanted into lethally irradiated WT mice (CD45.1). Meanwhile, 1 × 106 BM cells from WT mice (CD45.1) were transplanted into lethally irradiated WT or CD63−/− mice (CD45.2). Sixteen weeks later, recipient mice were used for subsequent analysis. K The strategy for reciprocal BMT. L The absolute numbers of LT-HSCs, ST-HSCs, and MPPs in the BM (one leg) of recipient mice (n = 6). Data are shown as the mean ± SD. **P < 0.01, ***P < 0.001. M The cell cycle status of LT-HSCs in the BM of recipient mice (n = 6). Data are shown as the mean ± SD. ***P < 0.001.
Fig. 6
Fig. 6. CD63 deficiency impairs TGFβ signaling in HSCs.
A GSEA of the RNA-seq data from CD63-/lo and CD63hi LT-HSCs. GSEA plot of TGFβ signaling pathway is shown. B Flow cytometric analysis of p-Smad2S465/S467/Smad3S423/S425 expression in CD63-/lo and CD63hi LT-HSCs from the BM of normal mice (n = 5). Representative flow cytometric plots are shown in the left. Data are shown as the mean ± SD. ***P < 0.001. C Flow cytometric analysis of CD63 expression in p-Smad2/3-/low (p-Smad2/3-/lo) and p-Smad2/3high (p-Smad2/3hi) LT-HSCs from the BM of normal mice (n = 5). LT-HSCs were divided into p-Smad2/3-lo (down 30%) and p-Smad2/3hi (up 30%) fractions based on the expression of p-Smad2/3. Data are shown as the mean ± SD. ***P < 0.001. D Flow cytometric analysis of p-Smad2S465/S467/Smad3S423/S425 expression in LT-HSCs from the BM of WT and CD63−/− mice (n = 5). Representative flow cytometric plots are shown in the left. Data are shown as the mean ± SD. ***P < 0.001. E, F Flow cytometric analysis of (E) TβRI and (F) TβRII expression in LT-HSCs from the BM of WT and CD63−/− mice (n = 5). Data are shown as the mean ± SD. TβRI, TGFβ receptor I; TβRII, TGFβ receptor II. G Enzyme linked immunosorbent assay (ELISA) analysis of TGFβ1 level in the BM of WT and CD63−/− mice (n = 5). Data are shown as the mean ± SD. H Western blot analysis of p-Smad2S465/S467 expression in LSKs freshly sorted from the BM of WT and CD63−/− mice. Representative Western blot plots of three biological replicates are shown. I Immunofluorescence analysis of p-Smad2S465/S467 expression in LT-HSCs freshly sorted from the BM of WT and CD63−/− mice. Representative immunofluorescence images of three biological replicates are shown. The scale bar indicates 10 μm. J qRT-PCR analysis of the expression of p21, p27, p57, and c-myc in LT-HSCs freshly sorted from the BM of WT and CD63−/− mice (n = 3). Data are shown as the mean ± SD. **P < 0.01.
Fig. 7
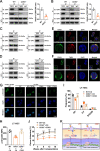
Fig. 7. CD63 regulates TGFβ signaling by interacting with TGFβ receptors I and II.
A, B Co-immunoprecipitation (Co-IP) analysis of the interaction of TβRI and TβRII in Lin- cells freshly sorted from the BM of WT and CD63−/− mice. The whole-cell lysates (WCL) were used as input and loading control. Representative immunoblotting (IB) plots of three biological replicates are shown in the left. Quantitation analysis of (A) relative TβRI/TβRII or (B) TβRII/TβRI ratio is shown in the right. Data are shown as the mean ± SD. **P < 0.01. C, D Co-IP analysis of the interaction between CD63 and (C) TβRI or (D) TβRII in Lin- cells freshly sorted from the BM of normal mice. The whole-cell lysates (WCL) were used as input and loading control. Representative IB plots of three biological replicates are shown. E, F Immunofluorescence analysis of the colocalization of CD63 with (E) TβRI or (F) TβRII in LT-HSCs freshly sorted from the BM of normal mice. Representative immunofluorescence images of three biological replicates are shown. The scale bar indicates 10 μm. Statistics of Pearson’s correlation coefficient from 30 cells are (E) 0.839 ± 0.081 and (F) 0.821 ± 0.076, respectively. Data represent as the mean ± SD. G LT-HSCs from the BM of WT and CD63−/− mice were sorted in StemSpan SFEM with or without containing TGFβ1 and were incubated at 37 °C for 30 min. Then, cells were stimulated with SCF and TPO and incubated at 37 °C for another 30 min. After that, the expression of p-Smad2S465/S467 was detected by immunofluorescence. Freshly sorted WT LT-HSCs were served as positive controls. Representative immunofluorescence images of three biological replicates are shown. The scale bar indicates 10 μm. HJ LSKs from the BM of WT and CD63−/− mice were transducted with lentivirus carrying control (Ctl) or CD63 gene. Then, 5 × 103 transducted LSKs (GFP+), together with 5 × 105 CD45.1 BM helper cells, were transplanted into lethally irradiated CD45.1 recipient mice. Sixteen weeks later, (H) p-Smad2S465/S467/Smad3S423/S425 expression and (I) cell cycle status in donor-derived LT-HSCs, as well as (J) the percentage of donor-derived cells in the PB, in recipient mice were measured by flow cytometry (n = 5). Data are shown as the mean ± SD. ***P < 0.001, compared with WT+Ctl group; ###P < 0.001, compared with CD63−/−+Ctl group. K Schematic diagram revealing how CD63 regulates the quiescence of HSCs.

Similar articles

Cited by

References

    1. Cheng H, Zheng Z, Cheng T. New paradigms on hematopoietic stem cell differentiation. Protein Cell. 2020;11:34–44. - PMC - PubMed
    1. Will B, Vogler TO, Bartholdy B, Garrett-Bakelman F, Mayer J, Barreyro L, et al. Satb1 regulates the self-renewal of hematopoietic stem cells by promoting quiescence and repressing differentiation commitment. Nat Immunol. 2013;14:437–45. - PMC - PubMed
    1. Zhao M, Perry JM, Marshall H, Venkatraman A, Qian P, He XC, et al. Megakaryocytes maintain homeostatic quiescence and promote post-injury regeneration of hematopoietic stem cells. Nat Med. 2014;20:1321–6. - PubMed
    1. Boulais PE, Frenette PS. Making sense of hematopoietic stem cell niches. Blood. 2015;125:2621–9. - PMC - PubMed
    1. Sinha S, Dwivedi TR, Yengkhom R, Bheemsetty VA, Abe T, Kiyonari H, et al. Asrij/OCIAD1 suppresses CSN5-mediated p53 degradation and maintains mouse hematopoietic stem cell quiescence. Blood. 2019;133:2385–2400. - PubMed

Publication types

Substances