. 2021 Aug 2;22(15):8300.
doi: 10.3390/ijms22158300.

MiR-7-5p Is Involved in Ferroptosis Signaling and Radioresistance Thru the Generation of ROS in Radioresistant HeLa and SAS Cell Lines

Affiliations

MiR-7-5p Is Involved in Ferroptosis Signaling and Radioresistance Thru the Generation of ROS in Radioresistant HeLa and SAS Cell Lines

Kazuo Tomita et al. Int J Mol Sci. .

Abstract

In cancer therapy, radioresistance or chemoresistance cells are major problems. We established clinically relevant radioresistant (CRR) cells that can survive over 30 days after 2 Gy/day X-ray exposures. These cells also show resistance to anticancer agents and hydrogen peroxide (H2O2). We have previously demonstrated that all the CRR cells examined had up-regulated miR-7-5p and after miR-7-5p knockdown, they lost radioresistance. However, the mechanism of losing radioresistance remains to be elucidated. Therefore, we investigated the role of miR-7-5p in radioresistance by knockdown of miR-7-5p using CRR cells. As a result, knockdown of miR-7-5p increased reactive oxygen species (ROS), mitochondrial membrane potential, and intracellular Fe2+ amount. Furthermore, miR-7-5p knockdown results in the down-regulation of the iron storage gene expression such as ferritin, up-regulation of the ferroptosis marker ALOX12 gene expression, and increases of Liperfluo amount. H2O2 treatment after ALOX12 overexpression led to the enhancement of intracellular H2O2 amount and lipid peroxidation. By contrast, miR-7-5p knockdown seemed not to be involved in COX-2 and glycolysis signaling but affected the morphology of CRR cells. These results indicate that miR-7-5p control radioresistance via ROS generation that leads to ferroptosis.

Keywords: ALOX12; Fe2+; clinically relevant radioresistant (CRR) cells; ferroptosis; microRNA; reactive oxygen species (ROS).


Conflict of interest statement

The authors declare no conflict of interest. The funders had no role in the design of the study; in the collection, analyses, or interpretation of data; in the writing of the manuscript, or in the decision to publish the results.

Figures

Figure 1
Figure 1
Knockdown of miR-7-5p increased ROS in CRR cells. Cells were treated with 10 µM HPF and 5 µM mitoSOXTM red to detect OH and mitochondrial superoxide (O2•−) after a miR-7-5p knockdown, respectively. HPF is a fluorescent probe, which detects hydroxyl radical in cells and mitoSOXTM red is a reagent that emits red fluorescence by reacting with mitochondrial superoxide. (AE) Intracellular OH visualized by HPF. (FJ) Mitochondrial O2•− visualized by mitoSOXTM red. (A,F) HeLa CRR cells siN.C. treatment. (B,G) HeLa CRR cells simiR-7-5p treatment. (C,H) SAS CRR cells siN.C. treatment. (D,I) SAS CRR cell simiR-7-5p treatment. (E) Relative HPF intensity (HeLa CRR N.C.: n = 60, HeLa CRR simiR-7-5p: n = 30, SAS CRR N.C.: n = 32, SAS CRR simiR-7-5p: n = 78). (J) Relative mitoSOXTM red intensity (HeLa CRR N.C.: n = 30, HeLa CRR simiR-7-5p: n = 11, SAS CRR N.C.: n = 77, SAS CRR simiR-7-5p: n = 31). **: p < 0.01 using Student’s t test. Knockdown of miR-7-5p significantly increased ROS.
Figure 2
Figure 2
Knockdown of miR-7-5p enhanced ΔΨm. ΔΨm was visualized by 2 µM JC-1 after the miR-7-5p knockdown. JC-1 is a fluorescent probe that is localized mitochondria and is changed fluorescence according to the membrane potential. (A) HeLa CRR cells siN.C. treatment. (B) HeLa CRR cell simiR-7-5p treatment. (C) SAS CRR cells siN.C. treatment. (D) SAS CRR cell simiR-7-5p treatment. (E) Relative JC-1 intensity (HeLa CRR N.C.: n = 11, HeLa CRR simiR-7-5p: n = 10, SAS CRR N.C.: n = 51, SAS CRR simiR-7-5p: n = 25). **: p < 0.01 using Student’s t test. Knockdown of miR-7-5p significantly increased ΔΨm.
Figure 3
Figure 3
Knockdown of miR-7-5p enhances ferroptosis signaling. To investigate whether ferroptosis signaling was enhanced by knockdown of miR-7-5p, ferroptosis–related gene expressions were performed by qPCR. (A) TFR. (B) Ferritin. (C) IRP2. (D) ALOX12. MiR-7-5p down-regulate iron-related gene expression and down-regulation of ferritin leads to an increase in intracellular free iron. The expression of ALOX12, which enhances ferroptosis, increased after the miR-7-5p knockdown. *: p < 0.05, **: p < 0.01 using Student’s t test. Each qPCR was performed 3 times.
Figure 4
Figure 4
Knockdown of miR-7-5p enhances Fe2+ and ferroptosis marker. Cells were treated with 1 µM FerroOrange and 20 µM Liperfluo to detect intracellular Fe2+ and lipid peroxidation after a miR-7-5p knockdown. (AE) Intracellular Fe2+ visualized by FerroOrange. (FJ) Ferroptosis marker visualized by Liperfluo. (A,F): HeLa CRR cells siN.C. treatment. (B,G) HeLa CRR cell simiR-7-5p treatment. (C,H) SAS CRR cells siN.C. treatment. (D,I) SAS CRR cells simiR-7-5p treatment. (E) Relative FerroOrange intensity (HeLa CRR N.C.: n = 41, HeLa CRR simiR-7-5p: n = 72, SAS CRR N.C.: n = 16, SAS CRR simiR-7-5p: n = 63). (J) Relative Liperfluo intensity (HeLa CRR N.C.: n = 17, HeLa CRR simiR-7-5p: n = 12, SAS CRR N.C.: n = 32, SAS CRR simiR-7-5p: n = 51). **: p < 0.01 using Student’s t-test. Knockdown of miR-7-5p significantly enhanced Fe2+ amount and Liperfluo signal.
Figure 5
Figure 5
Expression of ALOXs in CRR cells. ALOX5, 12, and 15 expressions in parent and CRR cells were detected using qPCR (AC) and western blotting (D). A: Gene expression of ALOX5. (B) Gene expression of ALOX12. C: Gene expression of ALOX15. **: p < 0.01 using Student’s t-test. Each qPCR was performed 3 times. Gene expressions of ALOX5, 12, and 15 were all significantly down-regulated in CRR cells. (D) Western blotting of ALOX5, 12, and 15. The table shows the expression level of each ALOXs in CRR cells. After correcting the intensity of each band by the expression of β-actin, the value is shown with the parent strain as 1. The protein expressions of ALOX5 and 12 were down-regulated in CRR cells. However, ALOX15 was not down-regulated in protein level in SAS CRR cells.
Figure 6
Figure 6
ALOX12 enhances intracellular ROS and lipid peroxidation. Cells were treated with 2.5 µM HYDROP after 50 µM H2O2 treatment for 2 h (AD) to analyze the effect of ALOX12 on intracellular ROS generation. Lipid peroxidation was detected using an HNE antibody after 50 µM H2O2 treatment. (AE) Intracellular H2O2 visualized by HYDROP (FJ) Lipid peroxidation visualized by HNE antibody. (A,F) HeLa CRR cells siN.C. treatment. (B,G) HeLa CRR cells with ALOX12 overexpression. (C,H) SAS CRR cells siN.C. treatment. (D,I) SAS CRR cells with ALOX12 overexpression. (E) Relative HYDROP intensity (HeLa CRR N.C.: n = 144, HeLa CRR simiR-7-5p: n = 45, SAS CRR N.C.: n = 122, SAS CRR simiR-7-5p: n = 152). (J) Relative HNE intensity (HeLa CRR N.C.: n = 58, HeLa CRR simiR-7-5p: n = 83, SAS CRR N.C.: n = 57, SAS CRR simiR-7-5p: n = 87). **: p < 0.01 using Student’s t-test. ALOX12 significantly enhances intracellular ROS and lipid peroxidation after H2O2 treatment.
Figure 7
Figure 7
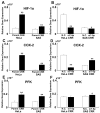
MiR-7-5p affect HIF-1α expression but not COX-2 and PFK expression. To reveal whether HIF-1α, COX-2, and PFK are involved in the resistance to radiotherapy and under control of miR-7-5p in CRR cells, qPCR was conducted. (A,B) Gene expression of HIF-1α. (C,D) Gene expression of COX-2. (E,F) Gene expression of PFK. (A,C,E) Gene expression of parent vs. CRR cells. (B,D,F) Gene expression of N.C. vs. miR-7-5p knockdown. HIF-1α, COX-2, and PFK were significantly up-regulated in CRR cells. However, only HIF-1α gene expression was regulated by miR-7-5p. *: p < 0.05, **: p < 0.01 using Student’s t-test. Each qPCR was performed 3 times.
Figure 8
Figure 8
Morphology of parent, CRR, NoIR, and simiR-7-5p cells. Morphology of the cells was observed under the optical microscope with 10× eyepieces and 10× objective lenses (magnification: 100×). (A) HeLa parental cells. (B) HeLa CRR cells. (C) HeLa CRR NoIR cells. (D) HeLa CRR cells that were knocked down by miR-7-5p. (E) SAS parental cells. (F) SAS CRR cells. (G) SAS CRR NoIR cells. (H) SAS CRR cells that were knocked down miR-7-5p. NoIR cells were cultured without 2 Gy/day irradiation for over 1 year and lost radioresistance. The cell shape of CRR cells looks small and tightly aggregated compared with that in parental cells. These characteristics are similar in NoIR cells, which lose radioresistance. Conversely, when miR-7-5p is knocked down, the cell–cell connections appear to loosen like the parental cells.

Similar articles

Cited by

References

    1. Finkel T. Signal transduction by reactive oxygen species. J. Cell Biol. 2011;194:7–15. doi: 10.1083/jcb.201102095. - DOI - PMC - PubMed
    1. Liou G.Y., Storz P. Reactive oxygen species in cancer. Free Radic. Res. 2010;44:479–496. doi: 10.3109/10715761003667554. - DOI - PMC - PubMed
    1. Kim W., Lee S., Seo D., Kim D., Kim K., Kim E., Kang J., Seong K.M., Youn H., Youn B. Cellular stress responses in radiotherapy. Cells. 2019;8:1105. doi: 10.3390/cells8091105. - DOI - PMC - PubMed
    1. Allawzi A., Elajaili H., Redente E.F., Nozik-Grayck E. Oxidative toxicology of bleomycin: Role of the extracellular redox environment. Curr. Opin. Toxicol. 2019;13:68–73. doi: 10.1016/j.cotox.2018.08.001. - DOI - PMC - PubMed
    1. Goradel N.H., Najafi M., Salehi E., Farhood B., Mortezaee K. Cyclooxygenase-2 in cancer: A review. J. Cell. Physiol. 2019;234:5683–5699. doi: 10.1002/jcp.27411. - DOI - PubMed