

Folding non-homologous proteins by coupling deep-learning contact maps with I-TASSER assembly simulations
- PMID: 34355210
- PMCID: PMC8336924
- DOI: 10.1016/j.crmeth.2021.100014
Folding non-homologous proteins by coupling deep-learning contact maps with I-TASSER assembly simulations
Abstract
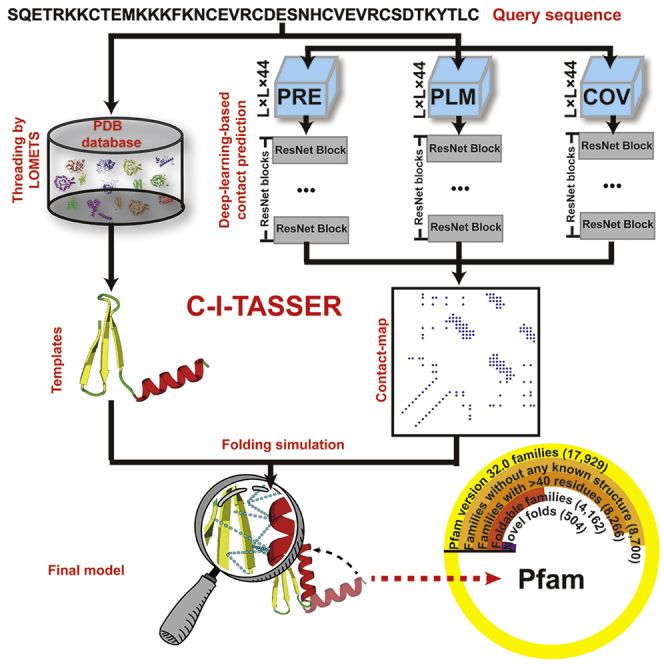
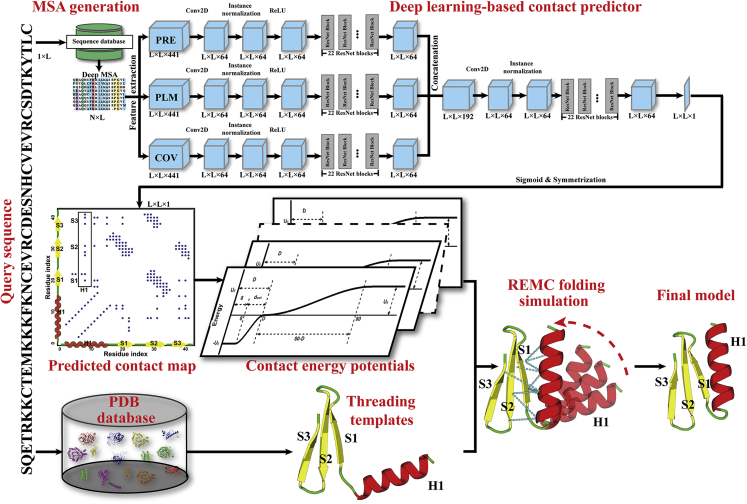
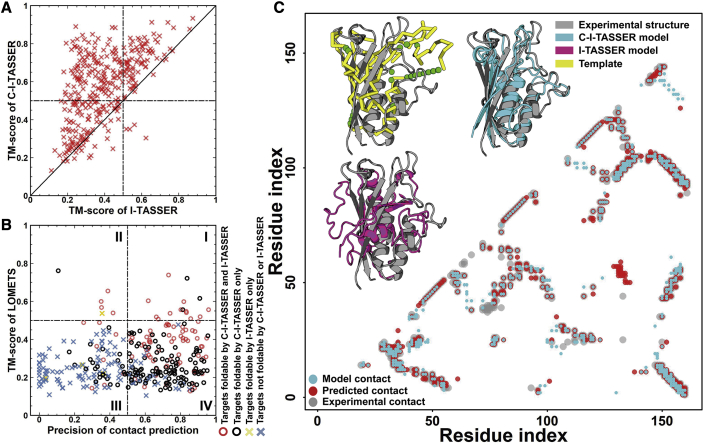
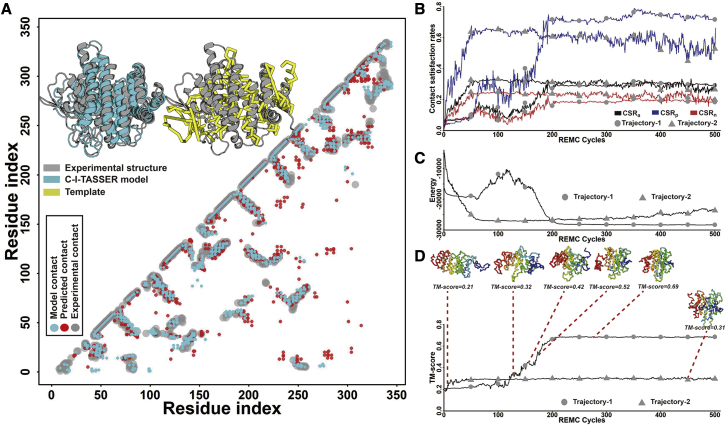
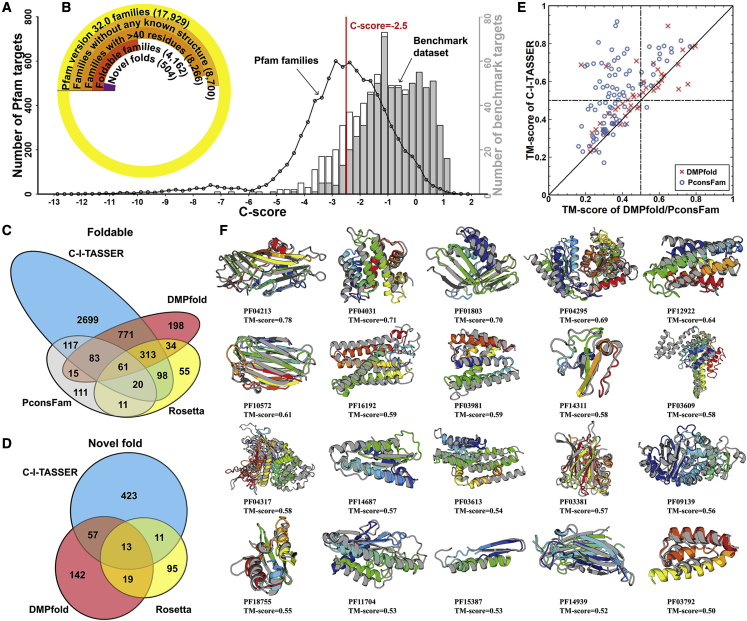
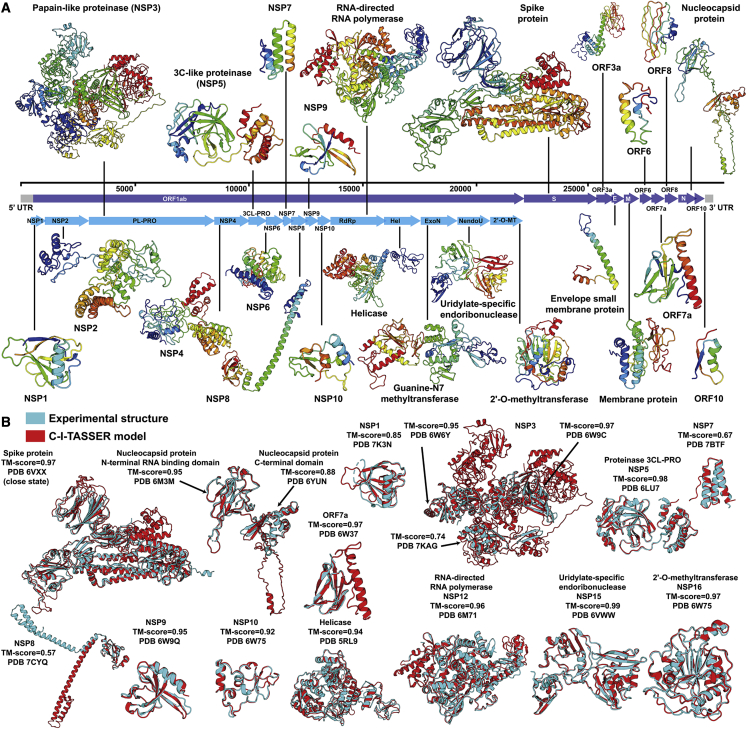
Structure prediction for proteins lacking homologous templates in the Protein Data Bank (PDB) remains a significant unsolved problem. We developed a protocol, C-I-TASSER, to integrate interresidue contact maps from deep neural-network learning with the cutting-edge I-TASSER fragment assembly simulations. Large-scale benchmark tests showed that C-I-TASSER can fold more than twice the number of non-homologous proteins than the I-TASSER, which does not use contacts. When applied to a folding experiment on 8,266 unsolved Pfam families, C-I-TASSER successfully folded 4,162 domain families, including 504 folds that are not found in the PDB. Furthermore, it created correct folds for 85% of proteins in the SARS-CoV-2 genome, despite the quick mutation rate of the virus and sparse sequence profiles. The results demonstrated the critical importance of coupling whole-genome and metagenome-based evolutionary information with optimal structure assembly simulations for solving the problem of non-homologous protein structure prediction.
Conflict of interest statement
DECLARATION OF INTERESTS The authors declare no competing interests.
Figures
Similar articles
-
Deep-learning contact-map guided protein structure prediction in CASP13.Proteins. 2019 Dec;87(12):1149-1164. doi: 10.1002/prot.25792. Epub 2019 Aug 14. Proteins. 2019. PMID: 31365149 Free PMC article.
-
Ab initio modeling of small proteins by iterative TASSER simulations.BMC Biol. 2007 May 8;5:17. doi: 10.1186/1741-7007-5-17. BMC Biol. 2007. PMID: 17488521 Free PMC article.
-
I-TASSER-MTD: a deep-learning-based platform for multi-domain protein structure and function prediction.Nat Protoc. 2022 Oct;17(10):2326-2353. doi: 10.1038/s41596-022-00728-0. Epub 2022 Aug 5. Nat Protoc. 2022. PMID: 35931779 Review.
-
Template-based and free modeling of I-TASSER and QUARK pipelines using predicted contact maps in CASP12.Proteins. 2018 Mar;86 Suppl 1(Suppl 1):136-151. doi: 10.1002/prot.25414. Epub 2017 Nov 14. Proteins. 2018. PMID: 29082551 Free PMC article.
-
How much metagenome data is needed for protein structure prediction: The advantages of targeted approach from the ecological and evolutionary perspectives.Imeta. 2022 Mar 6;1(1):e9. doi: 10.1002/imt2.9. eCollection 2022 Mar. Imeta. 2022. PMID: 38867727 Free PMC article. Review.
Cited by
-
Integration: Gospel for immune bioinformatician on epitope-based therapy.Front Immunol. 2023 Jan 31;14:1075419. doi: 10.3389/fimmu.2023.1075419. eCollection 2023. Front Immunol. 2023. PMID: 36798136 Free PMC article. No abstract available.
-
Molecular and Genetic Characterization of Hepatitis B Virus (HBV) among Saudi Chronically HBV-Infected Individuals.Viruses. 2023 Feb 6;15(2):458. doi: 10.3390/v15020458. Viruses. 2023. PMID: 36851671 Free PMC article.
-
Genome wide association analysis for grain micronutrients and anti-nutritional traits in mungbean [Vigna radiata (L.) R. Wilczek] using SNP markers.Front Nutr. 2023 Feb 7;10:1099004. doi: 10.3389/fnut.2023.1099004. eCollection 2023. Front Nutr. 2023. PMID: 36824166 Free PMC article.
-
In Silico Structural Analysis Predicting the Pathogenicity of PLP1 Mutations in Multiple Sclerosis.Brain Sci. 2022 Dec 24;13(1):42. doi: 10.3390/brainsci13010042. Brain Sci. 2022. PMID: 36672024 Free PMC article.
-
Examination of phase-variable haemoglobin-haptoglobin binding proteins in non-typeable Haemophilus influenzae reveals a diverse distribution of multiple variants.FEMS Microbiol Lett. 2022 Aug 1;369(1):fnac064. doi: 10.1093/femsle/fnac064. FEMS Microbiol Lett. 2022. PMID: 35867873 Free PMC article.
References
-
- Brunger A.T., Adams P.D., Clore G.M., DeLano W.L., Gros P., Grosse-Kunstleve R.W., Jiang J.S., Kuszewski J., Nilges M., Pannu N.S., et al. Crystallography & NMR system: a new software suite for macromolecular structure determination. Acta Crystallogr. D Biol. Crystallogr. 1998;54:905–921. doi: 10.1107/s0907444998003254. - DOI - PubMed
Publication types
MeSH terms
Substances
Grants and funding
LinkOut - more resources
Full Text Sources
Medical
Miscellaneous
