. 2021 Aug 10;54(8):1745-1757.e7.
doi: 10.1016/j.immuni.2021.07.005. Epub 2021 Aug 3.

Environmental enteric dysfunction induces regulatory T cells that inhibit local CD4+ T cell responses and impair oral vaccine efficacy

Affiliations

Environmental enteric dysfunction induces regulatory T cells that inhibit local CD4+ T cell responses and impair oral vaccine efficacy

Amrita Bhattacharjee et al. Immunity. .

Abstract

Environmental enteric dysfunction (EED) is a gastrointestinal inflammatory disease caused by malnutrition and chronic infection. EED is associated with stunting in children and reduced efficacy of oral vaccines. To study the mechanisms of oral vaccine failure during EED, we developed a microbiota- and diet-dependent mouse EED model. Analysis of E. coli-labile toxin vaccine-specific CD4+ T cells in these mice revealed impaired CD4+ T cell responses in the small intestine and but not the lymph nodes. EED mice exhibited increased frequencies of small intestine-resident RORγT+FOXP3+ regulatory T (Treg) cells. Targeted deletion of RORγT from Treg cells restored small intestinal vaccine-specific CD4 T cell responses and vaccine-mediated protection upon challenge. However, ablation of RORγT+FOXP3+ Treg cells made mice more susceptible to EED-induced stunting. Our findings provide insight into the poor efficacy of oral vaccines in EED and highlight how RORγT+FOXP3+ Treg cells can regulate intestinal immunity while leaving systemic responses intact.

Keywords: AIEC; E coli; EED; RORgt Treg; Tregs; diet; intestinal; microbiota; oral vaccination; stunting.


Conflict of interest statement

Declaration of interests The authors declare no competing interests.

Figures

Figure 1
Figure 1. Murine EED is associated with weight loss, growth stunting and increased intestinal permeability
A) Schematic of the EED protocol. ISO (blue) and MT8 (violet) mice received control diets while MAL (green) and EED (red) mice were provided low protein/fat diets. EED and MT8 mice were colonized with CUMT8 E. coli. B) Percent weight gain during EED protocol. Dotted vertical lines represent days when CUMT8 E. coli was orally gavaged. Data shown are representative of 3 independent experiments (n=4). Data points represent mean +/−SEM. Statistics calculated from weights at day 28. C-G show analyses from day 28 of the EED protocol. Data points represent a single mouse C) Tail lengths. Data shown are one representative example of 3 independent experiments D) Representative Hematoxylin and Eosin staining of ileal sections. Representative of 2 separate experiments. E) Histological scoring of D). Pooled from 2 independent experiments (n=3/experiment) F) Measurement of intestinal permeability by quantification of serum FITC Dextran (4kDA) concentration 4 hrs. after oral gavage. Data are pooled from 2 independent experiments (n=3-4/experiment). G) Level of CUMT8 E. coli in ileal samples from day 23 and day 28 of the EED protocol. Genomic DNA was isolated from ileal contents and the abundance of CUMT8 was measured by qPCR and compared against a standard curve. Dotted lines represent limit of detection. Data are pooled from 2 separate experiments (n=3-4/experiment). Graphs show the mean ±SEM. Statistics calculated by one-way ANOVA (*p ≤ 0.05; **p ≤ 0.01; ***p ≤ 0.001; ****p ≤ 0.0001).
Figure 2.
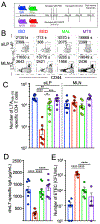
Figure 2.. EED induces tissue-specific oral vaccine failure
A) Schematic of the EED protocol and oral vaccination regime. B) Representative flow cytometric plots showing LT166-176:I-Ab specific CD4+ T cells from the siLP and MLN, 14 days after primary vaccination with dmLT (day 42). Cells gated: Live, Lineage, CD90+, CD3+, CD8b, CD4+. Numbers on plots denote mean and SEM, respectively. Data are representative examples of 3 independent experiments. C) Quantification B. Data are pooled from 3 independent experiments (n=2-3/experiment). D) Concentration of LT-specific IgA in the small intestine (from PBS lavage) of mice from C. E) Mice in the EED protocol were vaccinated with dmLT as shown in A. After vaccination (day 42 or 45) mice were colonized with ETEC H10407 (KanaR) and a day later numbers of bacterial CFU counted on LB/Kanamycin plates. Data are pooled from 2 separate experiments (n=3/experiment). (C-E) Data points represent a single mouse. Graphs show the mean ±SEM. Statistics calculated by one-way ANOVA (*p ≤ 0.05; **p ≤ 0.01; ***p ≤ 0.001; ****p ≤ 0.0001).
Figure 3
Figure 3. EED-associated shifts in the intestinal microbiome are necessary for oral vaccine failure.
A) Schematic of EED protocol, antibiotic treatment and vaccination regime. Mice on ISO or EED protocols were treated with antibiotics for 3 weeks, ending on day 49 when they are orally vaccinated. B) Numbers of LTA166-176:I-Ab specific CD4+ T cells isolated from the siLP and MLN of mice vaccinated after 3 weeks of treatment with (shaded bars) or without (clear bars) antibiotics. Data points represent a single mouse. Data are pooled from 2 independent experiments (n=3/experiment). Graphs show the mean ±SEM. Statistics calculated by one-way ANOVA (*p ≤ 0.05; **p ≤ 0.01; ***p ≤ 0.001; ****p ≤ 0.0001).
Figure 4
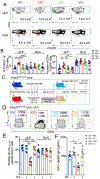
Figure 4. EED-induced Treg cells are necessary for intestinal oral vaccine failure
(A and B) Mice were placed on the ISO, EED, MAL or MT8 protocols as shown in Fig 1A and sacrificed on day 28. A) Representative flow cytometric plots showing percent FOXP3+ CD4+ T cells from the siLP and MLN, as indicated. Gated: Live, CD90+, TCRb+, CD8b, CD4+. Numbers on plots denote mean and SEM, respectively. Data are representative of 3 independent experiments (n=3/experiment). B) Percent (left) and numbers (right) of CD4+FOXP3+ T cells from siLP and MLNs from (A). Data are pooled from 3 experiments. C) Schematic of mouse Treg cell depletion experiments using the ISO or EED protocol, Foxp3DTR-GFP mice and treatment with Diphtheria toxin (C-F). D) Representative flow cytometric plots of LTA166-176:I-Ab specific CD4+ T cells following oral vaccination of Foxp3DTR-GFP mice with dmLT as in Fig. 2. Mice were treated with DT as indicated. Numbers on plots denote mean and SEM, respectively. Data shown are representative of 2 independent experiments (n=3/experiment) E) Number of LTA166-176:I-Ab specific CD4+ T cells calculated from D). Shown are 2 pooled experiments. F) Concentration of LT-specific IgA in the small intestine (from PBS lavage) from (E). Data points represent a single mouse. Graphs show the mean ±SEM. Statistics calculated by one-way ANOVA (*p ≤ 0.05; **p ≤ 0.01; ***p ≤ 0.001; ****p ≤ 0.0001).
Figure 5.
Figure 5.. EED induces intestinal RORγT-expressing Treg cells that potently suppress CD4+ T cell responses
Mice were placed on the EED protocol as shown in Fig 1A and sacrificed on day 28 A) Flow cytometric histograms showing percent Ki67 expression in FOXP3+CD4+ Treg cells from the siLP. Numbers on plots denote mean and SEM, respectively. Data shown is representative of 2 separate experiments (n=3/experiment) B) Mean Fluorescence Intensity (MFI) of Ki67 expression from A). Data pooled from 2 experiments C) Percent suppression of naïve CD4+ T cell proliferation by siLP Treg cells from EED mice or ISO controls (n=5). Top is line graph showing relative suppression at different cellular concentrations. Bottom is representative histograms of Tconv CFSE dilution. Black histograms represent suppression by splenic Treg cells from ISO mice. Data points and error bars represent mean and SEM respectively (**p % 0.01; 2-way ANOVA). Data shown are representative of 2 independent experiments where siLP Treg cells were sorted from 4 EED and 4 ISO mice. D) Representative flow cytometric contour plots of RORγT expression on siLP (top) and MLN (bottom) FOXP3+ CD4+ Treg cells. Numbers on plots denote mean and SEM, respectively. Data shown are representative of 3 independent experiments (n=3/experiment). E) Percent and F) numbers of FOXP3+ CD4+ Treg cells from D) that express RORγT. Data is pooled from 3 separate experiments. B, E-F) Data points represent a single mouse. Graphs show the mean ±SEM. Statistics for B,E and F were calculated by one-way ANOVA (*p ≤ 0.05; **p ≤ 0.01; ***p ≤ 0.001; ****p ≤ 0.0001).
Figure 6.
Figure 6.. Blocking RORγT induction in EED induced Treg cells restores oral vaccine responses
A) Schematic of ISO or EED protocols, tamoxifen (TX) or vehicle(Veh; corn oil) treatment for RORγT deletion and oral vaccination and in Foxp3Cre ERT2 Rorcfl/fl mice (FOXP3RORgT+/−). (B-E) Data from mice which were treated with tamoxifen(FOXP3RORgT−) are represented in open circles while data from vehicle treated controls (FOXP3RORgT+) are in closed circles. B) Numbers of LT166-176:I-Ab specific CD4+ T cells isolated from the siLP and MLNs following oral vaccination with dmLT (as in Fig. 2A) of Foxp3Cre ERT2 Rorcfl/fl with and without tamoxifen treatment. Data is pooled from 2 separate experiments (n=3/experiment). C) Concentration of LT-specific IgA in the small intestine (from PBS lavage) of Foxp3Cre ERT2 Rorcfl/fl mice from mice from B. D)Foxp3Cre ERT2 Rorcfl/fl mice in the EED protocol were vaccinated with dmLT, with and without tamoxifen treatment as shown in 6A. After vaccination (day 42 or 45) mice were colonized with ETEC H10407 (KanaR) and a day later numbers of bacterial CFU counted on LB/Kanamycin plates. Data are pooled from 2 separate experiments (n=3/experiment). E) Percent weight gain during EED establishment in FOXP3Cre ERT2 Rorc fl/fl mice with and without tamoxifen treatment. Dotted lined represent days when CUMT8 E.coli was orally gavaged. Data shown is representative of 2 separate experiments (n=3-4/experiment). Statistics calculated from weights at day 28. Graphs show the mean ±SEM. Data points represent a single mouse. Statistics calculated by one-way ANOVA (*p ≤ 0.05; **p ≤ 0.01; ***p ≤ 0.001; ****p ≤ 0.0001)

Similar articles

Cited by

References

    1. Abdel-Gadir A, Stephen-Victor E, Gerber GK, Noval Rivas M, Wang S, Harb H, Wang L, Li N, Crestani E, Spielman S, et al. (2019). Microbiota therapy acts via a regulatory T cell MyD88/RORgammat pathway to suppress food allergy. Nat Med 25, 1164–1174. - PMC - PubMed
    1. Ansaldo E, Slayden LC, Ching KL, Koch MA, Wolf NK, Plichta DR, Brown EM, Graham DB, Xavier RJ, Moon JJ, et al. (2019). Akkermansia muciniphila induces intestinal adaptive immune responses during homeostasis. Science 364, 1179–1184. - PMC - PubMed
    1. Barnich N, and Darfeuille-Michaud A (2007). Adherent-invasive Escherichia coli and Crohn's disease. Curr Opin Gastroenterol 23, 16–20. - PubMed
    1. Bemark M, Hazanov H, Stromberg A, Komban R, Holmqvist J, Koster S, Mattsson J, Sikora P, Mehr R, and Lycke NY (2016). Limited clonal relatedness between gut IgA plasma cells and memory B cells after oral immunization. Nat Commun 7, 12698. - PMC - PubMed
    1. Bhattacharjee A, and Hand TW (2018). Role of nutrition, infection, and the microbiota in the efficacy of oral vaccines. Clin Sci (Lond) 132, 1169–1177. - PubMed

Publication types

MeSH terms

Substances