Adapting Protocols or Models for Use in Insulin-Requiring Diabetes and Islet Transplant Recipients
- PMID: 34335462
- PMCID: PMC8322616
- DOI: 10.3389/fendo.2021.611512
Adapting Protocols or Models for Use in Insulin-Requiring Diabetes and Islet Transplant Recipients
Abstract
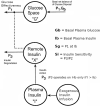
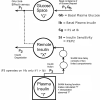
The authors' perspective is described regarding modifications made in their clinic to glucose challenge protocols and mathematical models in order to estimate insulin secretion, insulin sensitivity and glucose effectiveness in patients living with Insulin-Requiring Diabetes and patients who received Pancreatic Islet Transplants to treat Type I diabetes (T1D) with Impaired Awareness of Hypoglycemia. The evolutions are described of protocols and models for use in T1D, and Insulin-Requiring Type 2 Diabetes (T2D) that were the basis for studies in the Islet Recipients. In each group, the need for modifications, and how the protocols and models were adapted is discussed. How the ongoing application of the adaptations is clarifying the Islet pathophysiology in the Islet Transplant Recipients is outlined.
Keywords: C-peptide model; insulin secretion; insulin sensitivity; islet transplantation; mathematical modeling; minimal model; type 1 diabetes mellitus.
Copyright © 2021 Ward, Walters, Gooley and Boston.
Conflict of interest statement
The authors declare that the research was conducted in the absence of any commercial or financial relationships that could be construed as a potential conflict of interest.
Figures


Similar articles
-
Insulin sensitivity, glucose effectiveness, and free fatty acid dynamics after human islet transplantation for type 1 diabetes.J Clin Endocrinol Metab. 2006 Jun;91(6):2138-44. doi: 10.1210/jc.2005-2519. Epub 2006 Mar 28. J Clin Endocrinol Metab. 2006. PMID: 16569741
-
Achievement of insulin independence in three consecutive type-1 diabetic patients via pancreatic islet transplantation using islets isolated at a remote islet isolation center.Transplantation. 2002 Dec 27;74(12):1761-6. doi: 10.1097/00007890-200212270-00020. Transplantation. 2002. PMID: 12499894
-
Insulin sensitivity index in type 1 diabetes and following human islet transplantation: comparison of the minimal model to euglycemic clamp measures.Am J Physiol Endocrinol Metab. 2014 May 15;306(10):E1217-24. doi: 10.1152/ajpendo.00667.2013. Epub 2014 Apr 1. Am J Physiol Endocrinol Metab. 2014. PMID: 24691031 Free PMC article.
-
1921-2021: From insulin discovery to islet transplantation in type 1 diabetes.Ann Endocrinol (Paris). 2021 Apr;82(2):74-77. doi: 10.1016/j.ando.2021.03.006. Epub 2021 Apr 8. Ann Endocrinol (Paris). 2021. PMID: 33839122 Review.
-
Pancreatic islet cell therapy for type I diabetes: understanding the effects of glucose stimulation on islets in order to produce better islets for transplantation.J Transl Med. 2007 Jan 3;5:1. doi: 10.1186/1479-5876-5-1. J Transl Med. 2007. PMID: 17201925 Free PMC article. Review.
References
Publication types
MeSH terms
LinkOut - more resources
Full Text Sources
Medical

