. 2021 Jul 30;12(1):4626.
doi: 10.1038/s41467-021-24798-y.

PRMT1-dependent regulation of RNA metabolism and DNA damage response sustains pancreatic ductal adenocarcinoma

Affiliations

PRMT1-dependent regulation of RNA metabolism and DNA damage response sustains pancreatic ductal adenocarcinoma

Virginia Giuliani et al. Nat Commun. .

Abstract

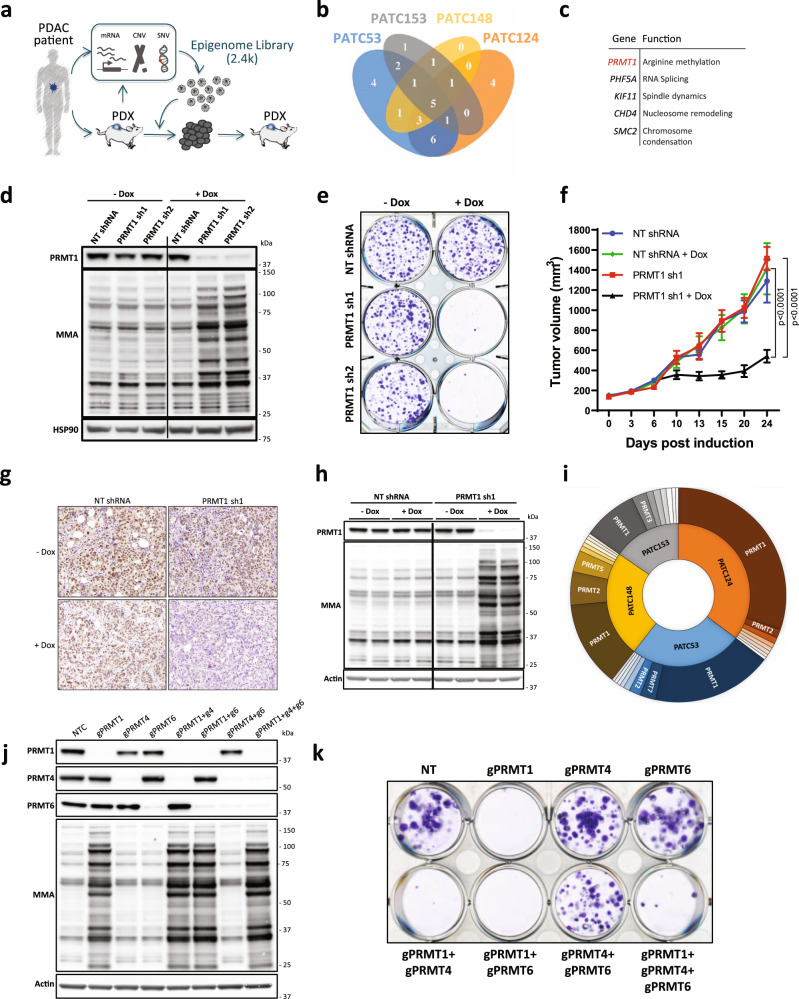
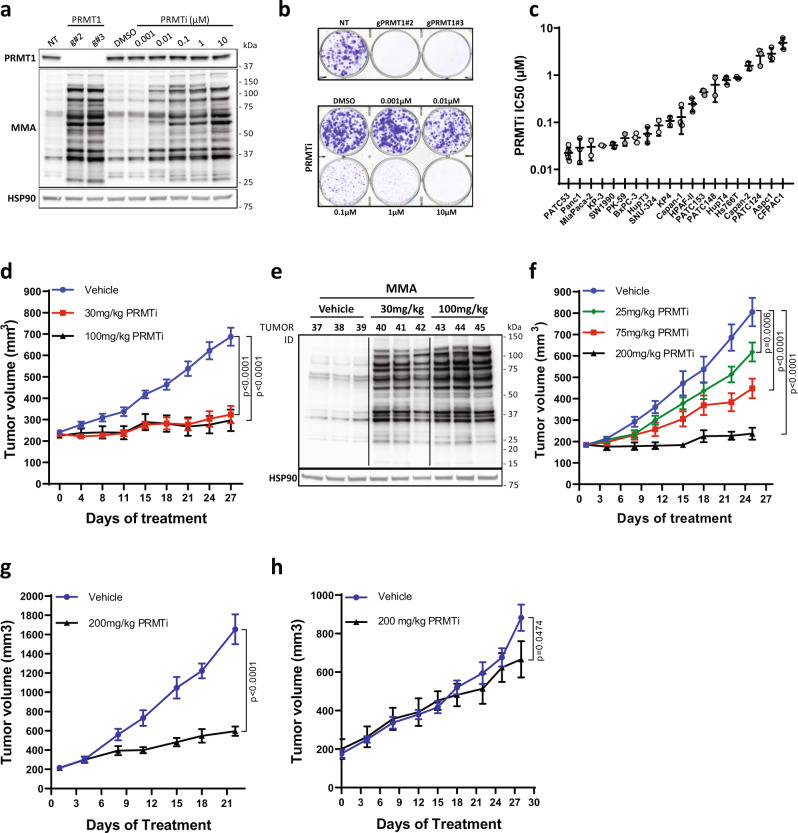
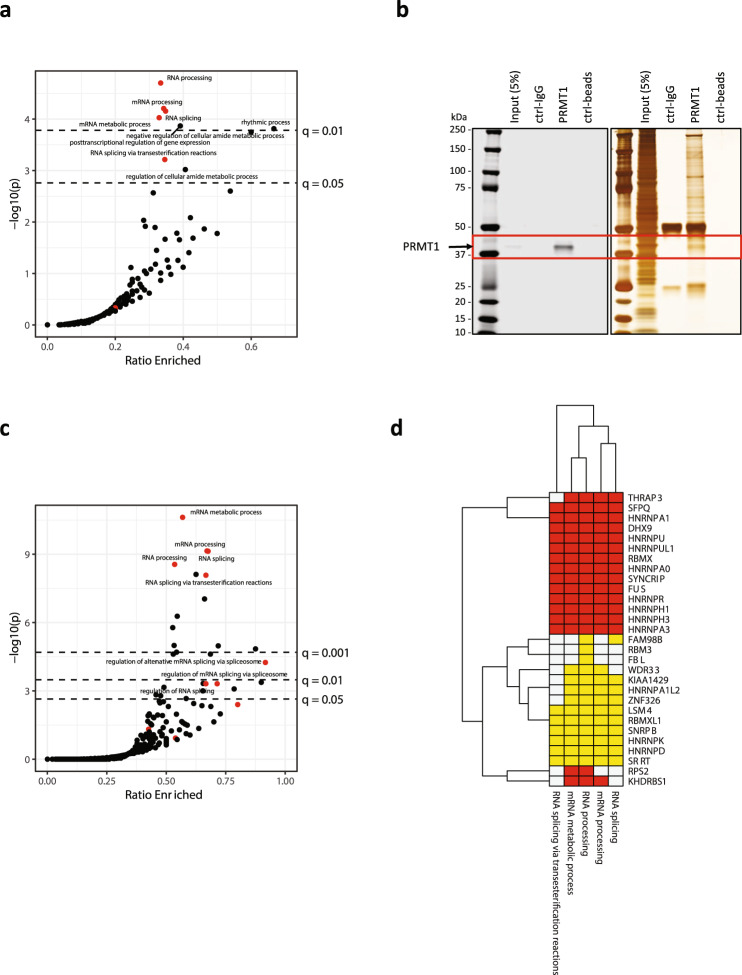
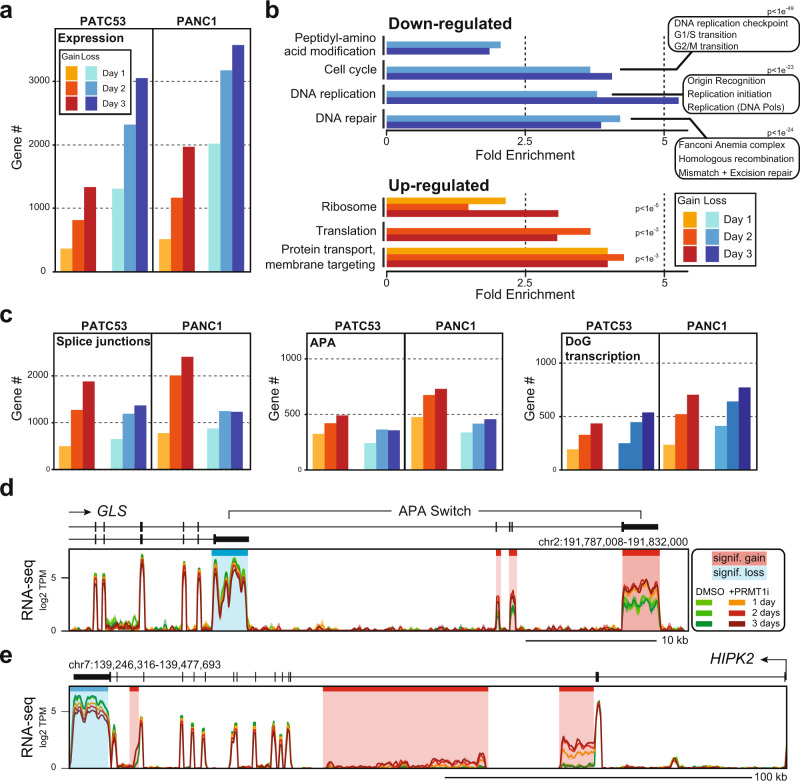
Pancreatic ductal adenocarcinoma (PDAC) is an aggressive cancer that has remained clinically challenging to manage. Here we employ an RNAi-based in vivo functional genomics platform to determine epigenetic vulnerabilities across a panel of patient-derived PDAC models. Through this, we identify protein arginine methyltransferase 1 (PRMT1) as a critical dependency required for PDAC maintenance. Genetic and pharmacological studies validate the role of PRMT1 in maintaining PDAC growth. Mechanistically, using proteomic and transcriptomic analyses, we demonstrate that global inhibition of asymmetric arginine methylation impairs RNA metabolism, which includes RNA splicing, alternative polyadenylation, and transcription termination. This triggers a robust downregulation of multiple pathways involved in the DNA damage response, thereby promoting genomic instability and inhibiting tumor growth. Taken together, our data support PRMT1 as a compelling target in PDAC and informs a mechanism-based translational strategy for future therapeutic development.Statement of significancePDAC is a highly lethal cancer with limited therapeutic options. This study identified and characterized PRMT1-dependent regulation of RNA metabolism and coordination of key cellular processes required for PDAC tumor growth, defining a mechanism-based translational hypothesis for PRMT1 inhibitors.


Conflict of interest statement

G. F. D. reports personal fees from and stock ownership in Karyopharm Therapeutics, Forma Therapeutics, Metabomed, BiovelocITA, Nurix and Orionis Biosciences; and personal fees from Blueprint Medicines, Taiho Pharmaceutical, Symphogen and Helsinn Ventures. T. P. H. reports personal fees and stock ownership from Cullgen Inc. The remaining authors declare no competing interests.

Figures

Fig. 1
Fig. 1. PRMT1 is a critical dependency in PDAC.
a Schematic representation of the PILOT platform to inform on patient-centric genetic dependencies. b Venn diagram (4-ellipses) displaying individual and common top-scoring hits across in patient-derived xenograft (PDX) screens in vivo (RSA LogP ≤ −1.5 in at least one PDX and FDR ≤ 0.3). c Gene name and function of the common top 5 scoring hits emerging from the PILOT platform. d Western Blot analysis of PRMT1 expression and mono-methylarginine (MMA) changes in PATC53 cells. Cells were engineered with two independent doxycycline (DOX)-inducible PRMT1-targeting (sh1, sh2) or non-targeting (NT) shRNA, and treated with or without 0.5 µg/mL DOX for 72 h. e Colony formation assay. Representative crystal violet staining image of PATC53 cells engineered with two independent DOX-inducible PRMT1-targeting (sh1, sh2) or non-targeting (NT) shRNA and treated with or without 0.5 µg/mL DOX for 14 days. f Tumor growth curve (mm3) of PATC53 xenografts harboring DOX-inducible PRMT1-targeting (sh1) or non-targeting (NT) control (n = 6 mice/group). Mice were randomized to either a DOX diet (200 mg/Kg) or control chow upon tumor establishment (150 mm3). Data are presented as the mean ± SEM and p values are calculated by 2-way ANOVA with multiple comparisons and Tukey’s correction. gh Evaluation of PRMT1 expression by immunohistochemistry (scale bar 50 µm, top left corner) (g) and Western Blot analysis (h) in PATC53 tumor lysates 10 days post-DOX-induction. MMA levels are also shown. i Sunburst plot representing the ranked impact, expressed as a percentage of 1/RSA p-value, of the different members of the PRMT family across genetic screens. jk Effect of CRISPR/Cas9-mediated knock-down of PRMT1, PRMT4, and PRMT6 individually or in combination on global arginine methylation status (j) and on cell growth, as assessed by colony formation assay, in PATC53 cells. Representative crystal violet staining image (k). Source data are provided as a Source Data file.
Fig. 2
Fig. 2. Inhibition of PRMT1 catalytic activity phenocopies genetic depletion and impairs PDAC growth.
a Western Blot analysis of PRMT1 expression and MMA in PATC53 cells either engineered with two independent guide RNA targeting PRMT1 or with a non-targeting (NT) control, or treated with DMSO or PRMTi in a dose-dependent manner for 48 h. b Colony formation assay. Representative crystal violet staining images of PATC53 cells upon CRISPR-Cas9-mediated knock-down of PRMT1 (upper panel) or treated with PRMTi in a dose-dependent manner (bottom panel). c PRMTi IC50 values across a panel of PDAC models as calculated by a dose-response curve in colony formation assay. Individual points represent IC50 values from independent experiments. Data are presented as the mean ± S.D. calculated from at least 2 independent experiments for each cell line. d Tumor growth curve (mm3) of PATC53 xenografts treated with PRMTi at 30 mg/kg and 100 mg/kg twice daily (BID). Data are presented as the mean ± SEM and p values are calculated by 2-way ANOVA with multiple comparisons and Tukey’s correction compared to vehicle control, n = 8–10 mice/group. e Western Blot analysis of MMA in PATC53 tumor lysates 7 days post-PRMTi treatment. f Tumor growth curve (mm3) of PANC1 xenografts treated with PRMTi at 25 mg/kg, 75 mg/kg, and 200 mg/kg once daily (QD). Data are presented as the mean ± SEM and p values are calculated by 2-way ANOVA with multiple comparisons and Tukey’s correction, compared to vehicle control (n = 8 mice/group). g Tumor growth curve (mm3) of the PATX153 PDX model treated with PRMTi at 200 mg/kg QD, 5on/2off. Data are presented as the mean ± SEM and p values are calculated by 2-way ANOVA with multiple comparisons and Sidak correction, compared to vehicle control (n = 5 mice/group). h Tumor growth curve (mm3) of the PATX60 PDX model treated with PRMTi at 200 mg/kg QD, 5on/2off. Data are presented as the mean ± SEM and p values are calculated by 2-way ANOVA with multiple comparisons and Sidak correction, compared to vehicle control (n = 4 mice/group vehicle; n = 3 mice/group PRMTi). Source data are provided as a Source Data file.
Fig. 3
Fig. 3. Proteins involved in RNA metabolism emerge as preferential PRMT1 substrates and binding partners.
a Analysis of PTMScan data from PATC53 cells treated with 1 µM PRMTi or DMSO control for 24 h. Enrichment analysis for gene ontology (GO) biological processes were conducted using Fisher’s exact test for proteins with MMA enrichment upon treatment vs. all proteins analyzed. The x-axis indicates the ratio of enriched vs. total genes analyzed per GO term. Dashed lines indicate FDR-adjusted significance thresholds at q = 0.05 and q = 0.01. GO terms associated with RNA splicing or processing highlighted in red, and four of the five splicing/processing sets were enriched with q < 0.05. b PRMT1 Western Blot (left) and Silver Staining (right) images of proteins isolated from PATC53 cells (input) and immunoprecipitated with anti-IgG or anti-PRMT1 antibodies. The red square denotes PRMT1 protein. c Enrichment analysis of PRMT1 IP-MS data in PATC53 cells. RNA processing and splicing terms are denoted with red points, all others are black. Dashed lines indicate FDR-adjusted significance thresholds at q = 0.05, q = 0.01, and q = 0.001. Eight of eleven RNA processing/splicing terms are enriched with q < 0.05. d PTMScan MMA analysis (yellow) shows enrichment of RNA processing gene sets, many of which are supported by both IP-MS and PTMScan data (red). Source data are provided as a Source Data file.
Fig. 4
Fig. 4. PRMT1 plays a critical role in regulating gene expression and co-transcriptional RNA processing.
a Number of genes showing significant gain or loss of gene expression in PATC53 and PANC1 cells treated with 1 µM PRMTi for 1, 2, and 3 days. b Significantly enriched gene ontology (GO) categories (PANTHER) for down or upregulated genes as a function of time after PRMTi treatment in the cells described in (a). Key GO categories and p-values of enrichment are indicated. c Number of genes showing significant gain or loss of splicing junctions, alternative polyadenylation (APA), and downstream of gene (DoG) transcription events in the cells described in (a). d Representative composite screenshots of RNA-seq data over GLS, a gene that undergoes a treatment- and time-specific APA switch between two annotated 3’-UTRs, in PANC1 cells. e Representative composite screenshots of RNA-seq data over HIPK2, a gene that similarly to GLS undergoes significant APA gains over previously unannotated 3’-UTRs (shaded red) and concomitant loss of distal 3’-UTR usage (shaded blue), in PATC53 cells. Data from control and PRMTi-treated cells are color-coded as indicated.
Fig. 5
Fig. 5. PRMT1 regulates key pathways involved in cell proliferation and DNA replication.
a Representative composite screenshot of RNA-seq data over CCND1, a gene that undergoes significant alternative polyadenylation gains (shaded red) and concomitant expression loss (shaded blue) in PANC1 cells treated with 1 µM PRMTi or DMSO control. b RT-qPCR validation of alternative polyadenylation in the CCND1 gene using primers indicated in (a) in PATC53 and PANC1 cells treated for 24 h, 48 h, or 72 h with 1 µM PRMTi or DMSO control. Data are presented as the mean ± SEM and p values are calculated by two-tailed Student’s t-test compared to DMSO-treated cells (n=independent experiments). c Western Blot analysis of Cyclin D1 in PATC53 and PANC1 cells treated with 1 µM PRMTi or DMSO control for indicated times. d Cell cycle profile of PATC53 cells treated with 1 µM PRMTi or DMSO control. Percentage of cells present in each cell cycle phase assessed by EdU or BrdU staining. Box-and-whisker plots in the panels depict 25–75% in the box, whiskers are down to the minimum and up to the maximum value, and median is indicated with a line in the middle of the box; p values are calculated by 2-way ANOVA compared to DMSO treated cells for each time point (n=independent experiments). e Western Blot analysis of indicated proteins in PATC53 cells treated with 1 µM PRMTi for the indicated time. HSP90 is shown as the representative loading control. f Replication restart in PATC53 cells treated with 1 µM PRMTi or DMSO control was evaluated by dual-labeling flow cytometry. Top panel: schematic representation of an experimental design. Middle panel: BrdU gating to select replicating cells. Bottom panel: plot showing replication restart as detected by EdU incorporation in BrdU positive cells immediately (0 h) and 24 h (24 h) after HU washout. g EdU incorporation in BrdU-positive cells post HU treatment was monitored by flow cytometry. Mean fluorescence intensity (MFI) of EdU is reported and normalized to 100 for PRMTi treated samples and controls at the time of HU washout (0 h). Data are presented as the mean ± S.D. and p values are calculated by 2-way ANOVA compared to DMSO treated cells for each time point (n=independent experiments). Source data are provided as a Source Data file.
Fig. 6
Fig. 6. PRMT1 coordinates the expression of DNA damage genes and maintains genome stability.
a Western Blot analysis of indicated proteins in PATC53 and PANC1 cells treated with PRMTi at different concentrations or with DMSO control. Tubulin is shown as the representative loading control. b Representative anti-γH2AX immunofluorescence in PATC53 and PANC1 cells treated with 1 µM PRMTi or DMSO control for 72 h (green: γH2AX; blue: DAPI). Scale bar 10 µm. c Box-and-whisker plot showing the distribution of the number of γH2AX foci/cell in PATC53, PANC1, and CFPAC1 cells treated with 1 µM PRMTi or DMSO control for 72 h. The panels depict 25–75% in the box, whiskers are down to the minimum and up to the maximum value, and the median is indicated with a line in the middle of the box. Data presented are from n = 180 (DMSO) and n = 145 (PRMTi) PATC53 treated cells examined over 2 independent experiments; n = 735 (DMSO) and n = 659 (PRMTi) PANC1 treated cells examined over 4 independent experiments; n = 504 (DMSO) and n = 565 (PRMTi) CFPAC1 treated cells examined over 3 independent experiments; p values are calculated by two-tailed student’s t-test compared to DMSO treated cells. d Representative images of Giemsa-stained metaphase spreads of PATC53 cells treated with 1 µM PRMTi or DMSO control for 7 days. Events are indicated by arrowheads. eg Frequency of chromosomal aberrations reported as a percentage of total metaphases in PATC53 and CFPAC1 cells treated with 1 µM PRMTi or DMSO control for 7 days. The total number of metaphases with aberrations (e), number of metaphases with breaks (f), and number of metaphases with fusions (g) are shown. Data are presented as the mean ± SEM and p values are calculated by two-tailed Student’s t-test compared to DMSO controls (ns= non-significant; n=independent experiments). hi Tumor growth curve (mm3) of PATX118 (h) and PATX45 (i) PDX models treated with PRMTi at 200 mg/kg QD, 5on/2off. Data are presented as the mean ± SEM and p values are calculated by 2-way ANOVA with multiple comparisons and Sidak correction, compared to vehicle control. For (h), n = 5 mice/group vehicle; n = 3 mice group PRMTi. For (i), n = 3 mice/group. Source data are provided as a Source Data file.

Similar articles

Cited by

References

    1. Rahib L, et al. Projecting cancer incidence and deaths to 2030: the unexpected burden of thyroid, liver, and pancreas cancers in the United States. Cancer Res. 2014;74:2913–2921. doi: 10.1158/0008-5472.CAN-14-0155. - DOI - PubMed
    1. Ying H, et al. Genetics and biology of pancreatic ductal adenocarcinoma. Genes Dev. 2016;30:355–385. doi: 10.1101/gad.275776.115. - DOI - PMC - PubMed
    1. Waddell N, et al. Whole genomes redefine the mutational landscape of pancreatic cancer. Nature. 2015;518:495–501. doi: 10.1038/nature14169. - DOI - PMC - PubMed
    1. Biankin AV, et al. Pancreatic cancer genomes reveal aberrations in axon guidance pathway genes. Nature. 2012;491:399–405. doi: 10.1038/nature11547. - DOI - PMC - PubMed
    1. Carugo A, et al. In vivo functional platform targeting patient-derived xenografts identifies WDR5-Myc association as a critical determinant of pancreatic cancer. Cell Rep. 2016;16:133–147. doi: 10.1016/j.celrep.2016.05.063. - DOI - PubMed

Publication types

MeSH terms