Metabolomic profiling of stool of two-year old children from the INSIGHT study reveals links between butyrate and child weight outcomes
- PMID: 34327846
- PMCID: PMC8647636
- DOI: 10.1111/ijpo.12833
Metabolomic profiling of stool of two-year old children from the INSIGHT study reveals links between butyrate and child weight outcomes
Abstract
Background: Metabolomic analysis is commonly used to understand the biological underpinning of diseases such as obesity. However, our knowledge of gut metabolites related to weight outcomes in young children is currently limited.
Objectives: To (1) explore the relationships between metabolites and child weight outcomes, (2) determine the potential effect of covariates (e.g., child's diet, maternal health/habits during pregnancy, etc.) in the relationship between metabolites and child weight outcomes, and (3) explore the relationship between selected gut metabolites and gut microbiota abundance.
Methods: Using 1 H-NMR, we quantified 30 metabolites from stool samples of 170 two-year-old children. To identify metabolites and covariates associated with children's weight outcomes (BMI [weight/height2 ], BMI z-score [BMI adjusted for age and sex], and growth index [weight/height]), we analysed the 1 H-NMR data, along with 20 covariates recorded on children and mothers, using LASSO and best subset selection regression techniques. Previously characterized microbiota community information from the same stool samples was used to determine associations between selected gut metabolites and gut microbiota.
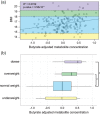
Results: At age 2 years, stool butyrate concentration had a significant positive association with child BMI (p-value = 3.58 × 10⁻⁴ ), BMI z-score (p-value = 3.47 × 10⁻⁴ ), and growth index (p-value = 7.73 × 10⁻⁴ ). Covariates such as maternal smoking during pregnancy are important to consider. Butyrate concentration was positively associated with the abundance of the bacterial genus Faecalibacterium (p-value = 9.61 × 10⁻³ ).
Conclusions: Stool butyrate concentration is positively associated with increased child weight outcomes and should be investigated further as a factor affecting childhood obesity.
Keywords: 1-HNMR; butyrate; childhood obesity; metabolomics; weight outcomes at 2-years.
© 2021 The Authors. Pediatric Obesity published by John Wiley & Sons Ltd on behalf of World Obesity Federation.
Conflict of interest statement
The authors declare no financial or other conflicts of interests.
Figures


Similar articles
-
Childhood body mass index and associations with infant gut metabolites and secretory IgA: findings from a prospective cohort study.Int J Obes (Lond). 2022 Sep;46(9):1712-1719. doi: 10.1038/s41366-022-01183-3. Epub 2022 Jul 15. Int J Obes (Lond). 2022. PMID: 35840772
-
Pre-pregnancy body mass index and gut microbiota of mothers and children 5 years postpartum.Int J Obes (Lond). 2023 Sep;47(9):807-816. doi: 10.1038/s41366-023-01322-4. Epub 2023 May 12. Int J Obes (Lond). 2023. PMID: 37173396 Free PMC article.
-
Roles of Birth Mode and Infant Gut Microbiota in Intergenerational Transmission of Overweight and Obesity From Mother to Offspring.JAMA Pediatr. 2018 Apr 1;172(4):368-377. doi: 10.1001/jamapediatrics.2017.5535. JAMA Pediatr. 2018. PMID: 29459942 Free PMC article.
-
[Simple obesity in children. A study on the role of nutritional factors].Med Wieku Rozwoj. 2006 Jan-Mar;10(1):3-191. Med Wieku Rozwoj. 2006. PMID: 16733288 Review. Polish.
-
Offspring body size and metabolic profile - effects of lifestyle intervention in obese pregnant women.Dan Med J. 2014 Jul;61(7):B4893. Dan Med J. 2014. PMID: 25123127 Review.
Cited by
-
Associations between maternal obesity and offspring gut microbiome in the first year of life.Pediatr Obes. 2022 Sep;17(9):e12921. doi: 10.1111/ijpo.12921. Epub 2022 Apr 27. Pediatr Obes. 2022. PMID: 35478493 Free PMC article. Clinical Trial.
-
Methylation profiles at birth linked to early childhood obesity.J Dev Orig Health Dis. 2024 Apr 25;15:e7. doi: 10.1017/S2040174424000060. J Dev Orig Health Dis. 2024. PMID: 38660759 Free PMC article.
-
Butyrate and obesity: Current research status and future prospect.Front Endocrinol (Lausanne). 2023 Feb 24;14:1098881. doi: 10.3389/fendo.2023.1098881. eCollection 2023. Front Endocrinol (Lausanne). 2023. PMID: 36909336 Free PMC article. Review.
-
Maternal smoking during pregnancy increases the risk of gut microbiome-associated childhood overweight and obesity.Gut Microbes. 2024 Jan-Dec;16(1):2323234. doi: 10.1080/19490976.2024.2323234. Epub 2024 Mar 4. Gut Microbes. 2024. PMID: 38436093 Free PMC article.
-
Microbiota-derived short chain fatty acids in pediatric health and diseases: from gut development to neuroprotection.Front Microbiol. 2024 Oct 8;15:1456793. doi: 10.3389/fmicb.2024.1456793. eCollection 2024. Front Microbiol. 2024. PMID: 39439941 Free PMC article. Review.
References
-
- Ogden CL, Carroll MD, Fryar CD, Flegal KM. Prevalence of obesity among adults and youth: United States, 2011‐2014. NCHS Data Brief. 2015;(219):1‐8. - PubMed
-
- Hales CM, Carroll MD, Fryar CD, Ogden CL. Prevalence of obesity among adults and youth: United States, 2015‐2016. NCHS Data Brief. 2017;(288):1‐8. - PubMed
-
- Turnbaugh PJ, Ley RE, Mahowald MA, Magrini V, Mardis ER, Gordon JI. An obesity‐associated gut microbiome with increased capacity for energy harvest. Nature. 2006;444(7122):1027‐1031. - PubMed
Publication types
MeSH terms
Substances
Grants and funding
LinkOut - more resources
Full Text Sources
Medical

