. 2021 Jul 13:9:685171.
doi: 10.3389/fcell.2021.685171. eCollection 2021.

Human Breast Milk Enhances Intestinal Mucosal Barrier Function and Innate Immunity in a Healthy Pediatric Human Enteroid Model

Affiliations

Human Breast Milk Enhances Intestinal Mucosal Barrier Function and Innate Immunity in a Healthy Pediatric Human Enteroid Model

Gaelle Noel et al. Front Cell Dev Biol. .

Abstract

Breastfeeding has been associated with long lasting health benefits. Nutrients and bioactive components of human breast milk promote cell growth, immune development, and shield the infant gut from insults and microbial threats. The molecular and cellular events involved in these processes are ill defined. We have established human pediatric enteroids and interrogated maternal milk's impact on epithelial cell maturation and function in comparison with commercial infant formula. Colostrum applied apically to pediatric enteroid monolayers reduced ion permeability, stimulated epithelial cell differentiation, and enhanced tight junction function by upregulating occludin. Breast milk heightened the production of antimicrobial peptide α-defensin 5 by goblet and Paneth cells, and modulated cytokine production, which abolished apical release of pro-inflammatory GM-CSF. These attributes were not found in commercial infant formula. Epithelial cells exposed to breast milk elevated apical and intracellular pIgR and enabled maternal IgA translocation. Proteomic data revealed a breast milk-induced molecular pattern associated with tissue remodeling and homeostasis. Using a novel ex vivo pediatric enteroid model, we have identified distinct cellular and molecular events involved in human milk-mediated improvement of human intestinal physiology and immunity.

Keywords: breastmilk; enteroid; epithelial barrier; innate immunity; occludin; pIgR polymeric immunoglobulin receptor; pediatric (infant).


Conflict of interest statement

The authors declare that the research was conducted in the absence of any commercial or financial relationships that could be construed as a potential conflict of interest.

Figures

FIGURE 1
FIGURE 1
Pediatric and adult enteroid monolayers exhibit distinct maturation features. (A) Schematic representation of the generation of pediatric enteroid monolayers. Scale bar: brightfield images, 100 μm; immunofluorescence images (XY and XZ projections), 20 μm. NDM, non-differentiation media; DFM, differentiation media. (B) Confocal microscopy images (XZ projections) depicting the difference in epithelial cell height between pediatric and adult enteroid monolayers. Actin, magenta; DNA, blue. Scale bar = 20 μm. (C) Epithelial cell heights quantified by immunofluorescent confocal microscopy analysis (≥8 different view fields). (D) TER values of enteroid monolayers. Images are representative of three independent experiments (B). Data shown in panel (C) and (D) represent the mean ± SEM from three (C) or two (D) independent experiments that included n = 8–12 enteroid monolayers/group per experiment. Each symbol represents an independent monolayer. (B–D) All measurements included 2 pediatric- and 3 adult-derived monolayers. (C,D) p-values were calculated by Student’s t-test. ***P < 0.001; ****P < 0.0001.
FIGURE 2
FIGURE 2
Human milk decreases ion permeability of the pediatric intestinal epithelium. (A) TER values of 2PD monolayers apically exposed to human milk (HM) 2 or 20% (v/v). (B) Schematic representation of pediatric HIE treatment and biological readouts. (C) TER measurement of 2PD and 5PD monolayers apically treated with 20% (v/v) of HM or 20% (w/v) of commercial infant formula (IF). (A,C) Mean ± SEM are shown. Data are representative of three independent experiments with n = 3–6 enteroid monolayers/group per experiment. p-values were calculated by Mann Whitney test. Unless indicated, p-values correspond to treated vs. non-treated (NT) controls. (D) Epithelial cell height quantified by immunofluorescent microscopy (≥10 different view fields). Data represent mean ± SEM of three combined experiments, each including four monolayers/group per experiment. Each symbol indicates an independent monolayer. p-values were calculated by one-way ANOVA with Tukey post hoc analysis. *P < 0.05; **P < 0.01; ***P < 0.001; ****P < 0.0001.
FIGURE 3
FIGURE 3
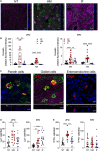
Human milk modulates occludin expression. (A) Confocal microscopy images (XY and YZ projections) of 2PD enteroid monolayers NT or apically treated for 24 h with HM (20%; v/v) or IF (20%; w/v). Occludin, green; actin, magenta. Scale bar = 10 μm. (B) Relative fluorescence intensity of occludin quantified by confocal microscopy analysis of monolayers treated with HM (20%; v/v) or IF (20%; w/v) for 24 and 72 h. Mean ± SEM are shown. Data represent three independents with n = 4–6 enteroid monolayers/group per experiment. Each symbol indicates an independent monolayer. p-values were calculated by one-way ANOVA with Šidák’s post hoc analysis. (C) Confocal microscopy images of 5PD enteroid monolayers treated with HM for 48 h. Occludin, green; lysozyme (Lyz), red; trefoil factor 3 (TFF3), red; chromogranin A (ChgA), red; actin, magenta; DNA, blue. Paneth and goblet cells, scale bar = 5 μm; enteroendocrine cells, scale bar = 10 μm. (A,C) Data are representative of three independent experiments with n = 3 enteroid monolayers/group per experiment. p-values were calculated by one-way ANOVA with Šidák’s post hoc analysis. (D) Number of Lyz-positive (E) and TFF3-positive cells quantified by immunofluorescent confocal microscopy analysis of monolayers treated with HM and IF as described in panel (A). Data represent mean ± SEM of three combined experiments, each including four monolayers/group per experiment. Each symbol indicates an independent monolayer. p-values were calculated by one-way ANOVA with Tukey post hoc analysis. *P < 0.05; **P < 0.01; ***P < 0.001; ****P < 0.0001.
FIGURE 4
FIGURE 4
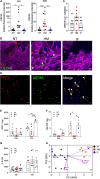
Human milk modulates epithelial innate immune function. (A) Relative fluorescence intensity of human DEFA5 quantified by confocal microscopy analysis of 2PD and 5PD monolayers NT or treated with HM (20%; v/v) or IF (20%; w/v) for 48 h. (B) Representative confocal microscopy images (XY projections) of 5PD monolayer showing localization (arrowheads) of DEFA5 in Lyz-negative cells in HM-treated monolayer and (C) number of Lyz-negative cells quantified by immunofluorescent confocal microscopy (≥6 different view fields). DEFA5, green; Lyz, red; actin, magenta; DNA, blue. Scale bar = 10 μm. (D) Representative confocal microscopy images (XY projections) of 5PD monolayer depicting co-localization (arrowheads) of TFF3 (red) and DEFA5 (green); DNA, blue. Scale bar = 50 μm. (E–G) Total amount of MCP-1, GM-CSF, and IL-8 in the apical media of 2PD monolayer treated with HM and IF as described in panel (A) for 24 and 72 h. (H) PCA plot from HM- and IF-treated monolayers, and NT controls for 24 h. PC, principal component. Variables analyzed: TER, occludin, DEFA5, MCP-1, GM-CSF, and IL-8. (A,C,E–G) Mean ± SEM are shown. Data are representative of three independent experiments with n = 6–12 enteroid monolayers/group per experiment. Each symbol indicates an independent monolayer. p-values were calculated by one-way ANOVA with Tukey’s post-test for multiple comparisons. *P < 0.05; **P < 0.01; ***P < 0.001; ****P < 0.0001.
FIGURE 5
FIGURE 5
Abundance of pIgR and sIgA translocation in breast milk-treated epithelial monolayers. (A) Confocal microscopy images showing SC-pIgR (top, XZ projections, scale bar = 10 μm; bottom, XY projection, scale bar = 5 μm) in 5PD enteroid monolayer NT or treated with 20% (v/v) of HM for 72 h. SC-pIgR, green; actin, red; DNA, blue. (B) Composite immunoblotting (IB) showing SC-pIgR and FcRn expression in NT 2PD and 5PD monolayers. (C) IB showing the presence of pIgR in HM and its absence in IF, and pIgR staining in 2PD and 5PD monolayers NT or treated for 48 h with 20% HM (v/v) or IF (w/v). (D) Total IgA and IgG determined by ELISA in the basolateral media of pediatric monolayers treated with HM and IF as described in panel (C). Data represent mean ± SEM of three experiments, each including two monolayers/group per experiment. Each symbol indicates an independent monolayer. Dashed line indicates limit of detection. p-value was calculated by Student’s t-test. **P < 0.01.
FIGURE 6
FIGURE 6
Human milk modifies epithelial cell protein expression and basolateral secretion. (A,B) Volcano plots of differential protein abundance (high false discovery rate) in the basolateral culture supernatant of 2PD monolayers NT or treated for 48 h with 20% HM (v/v) or IF (w/v). Data represent protein secreted by up to three monolayers per condition. Red dots indicate HM unique proteins; blue dots indicate epithelial cell-derived proteins; green dots indicate proteins derived from both HM and epithelial cells. (C) Protein-protein interaction analysis of 61 upregulated proteins produced by HM-treated monolayers selected based on the cut off shown in panel (A). High confidence interaction score = 0.700. Color line indicates types of protein-protein interactions based on co-expression (black line), co-occurrence (blue line), experimentally determined (magenta line), curated database (light blue line) and textmining search (green line). (D) Enrichment analysis of GO terms annotated for cellular component, molecular function, and biological process of the 61 upregulated proteins as described in panel (A).

Similar articles

Cited by

References

    1. Aaen K. H., Anthi A. K., Sandlie I., Nilsen J., Mester S., Andersen J. T. (2021). The neonatal Fc receptor in mucosal immune regulation. Scand. J. Immunol. 93:e13017. - PubMed
    1. Al-Sadi R., Khatib K., Guo S., Ye D., Youssef M., Ma T. (2011). Occludin regulates macromolecule flux across the intestinal epithelial tight junction barrier. Am. J. Physiol. Gastrointest. Liver Physiol. 300 G1054–G1064. - PMC - PubMed
    1. Andoh A., Fujiyama Y., Bamba T., Hosoda S. (1993). Differential cytokine regulation of complement C3, C4, and factor B synthesis in human intestinal epithelial cell line, Caco-2. J. Immunol. 151 4239–4247. - PubMed
    1. Andoh A., Kinoshita K., Rosenberg I., Podolsky D. K. (2001). Intestinal trefoil factor induces decay-accelerating factor expression and enhances the protective activities against complement activation in intestinal epithelial cells. J. Immunol. 167 3887–3893. - PubMed
    1. Austin K., Imam N. A., Pintar J. E., Brubaker P. L. (2015). IGF binding protein-4 is required for the growth effects of glucagon-like peptide-2 in murine intestine. Endocrinology 156 429–436. 10.1210/en.2014-1829 - DOI - PMC - PubMed