

Text mining of gene-phenotype associations reveals new phenotypic profiles of autism-associated genes
- PMID: 34315992
- PMCID: PMC8316556
- DOI: 10.1038/s41598-021-94742-z
Text mining of gene-phenotype associations reveals new phenotypic profiles of autism-associated genes
Abstract
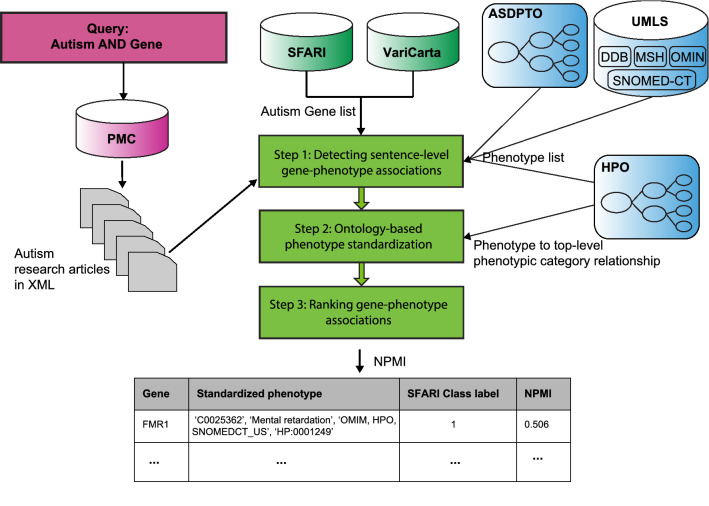
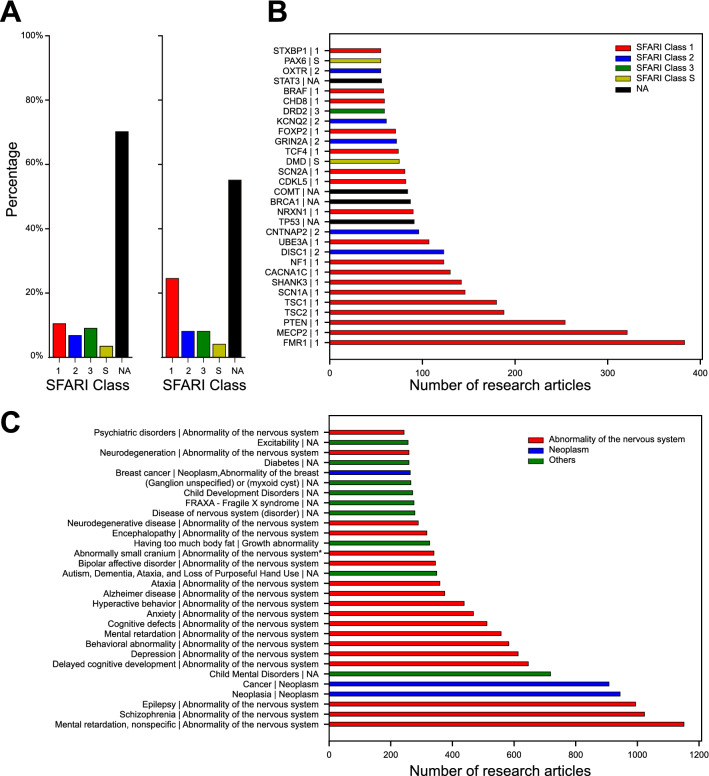
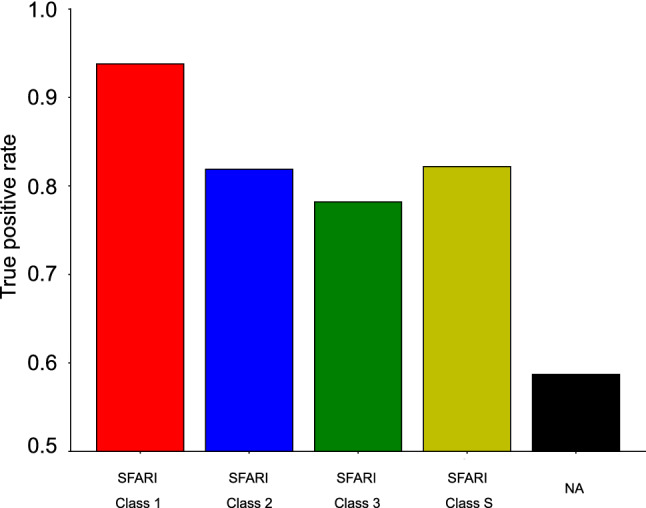
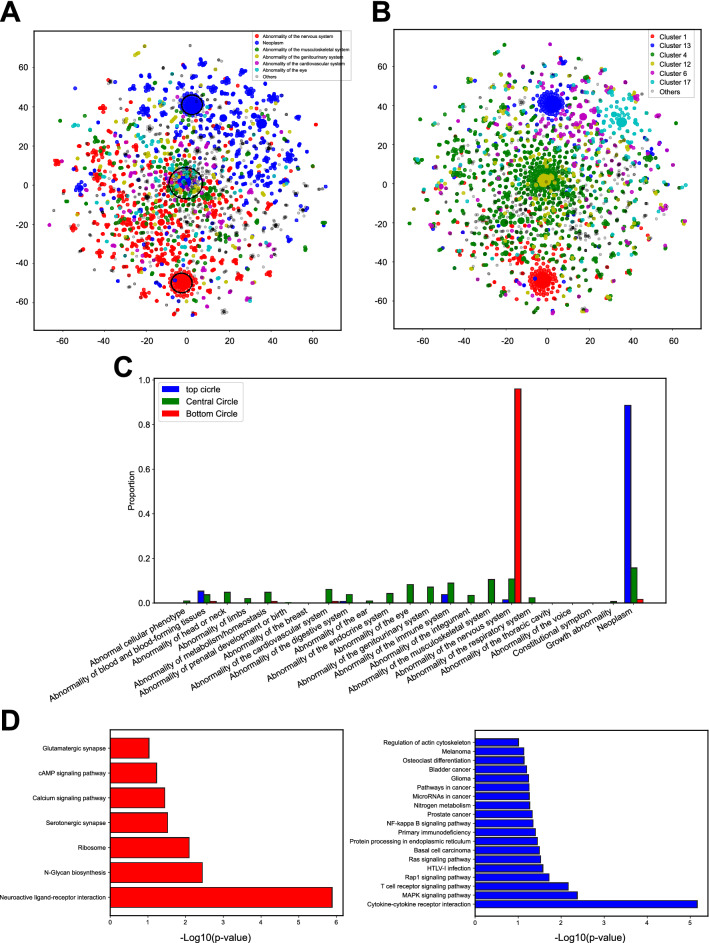
Autism is a spectrum disorder with wide variation in type and severity of symptoms. Understanding gene-phenotype associations is vital to unravel the disease mechanisms and advance its diagnosis and treatment. To date, several databases have stored a large portion of gene-phenotype associations which are mainly obtained from genetic experiments. However, a large proportion of gene-phenotype associations are still buried in the autism-related literature and there are limited resources to investigate autism-associated gene-phenotype associations. Given the abundance of the autism-related literature, we were thus motivated to develop Autism_genepheno, a text mining pipeline to identify sentence-level mentions of autism-associated genes and phenotypes in literature through natural language processing methods. We have generated a comprehensive database of gene-phenotype associations in the last five years' autism-related literature that can be easily updated as new literature becomes available. We have evaluated our pipeline through several different approaches, and we are able to rank and select top autism-associated genes through their unique and wide spectrum of phenotypic profiles, which could provide a unique resource for the diagnosis and treatment of autism. The data resources and the Autism_genpheno pipeline are available at: https://github.com/maiziezhoulab/Autism_genepheno .
© 2021. The Author(s).
Conflict of interest statement
The authors declare no competing interests.
Figures
Similar articles
-
Ontology based text mining of gene-phenotype associations: application to candidate gene prediction.Database (Oxford). 2019 Jan 1;2019:baz019. doi: 10.1093/database/baz019. Database (Oxford). 2019. PMID: 30809638 Free PMC article.
-
Heritable genotype contrast mining reveals novel gene associations specific to autism subgroups.J Biomed Inform. 2018 Jan;77:50-61. doi: 10.1016/j.jbi.2017.11.016. Epub 2017 Nov 29. J Biomed Inform. 2018. PMID: 29197649 Free PMC article.
-
Identifying phenotypic signatures of neuropsychiatric disorders from electronic medical records.J Am Med Inform Assoc. 2013 Dec;20(e2):e297-305. doi: 10.1136/amiajnl-2013-001933. Epub 2013 Aug 16. J Am Med Inform Assoc. 2013. PMID: 23956017 Free PMC article.
-
The genetics of autism.Pediatrics. 2004 May;113(5):e472-86. doi: 10.1542/peds.113.5.e472. Pediatrics. 2004. PMID: 15121991 Review.
-
Principal genetic syndromes and autism: from phenotypes, proteins to genes.Beijing Da Xue Xue Bao Yi Xue Ban. 2006 Feb 18;38(1):110-5. Beijing Da Xue Xue Bao Yi Xue Ban. 2006. PMID: 16415981 Review.
Cited by
-
Creation and evaluation of full-text literature-derived, feature-weighted disease models of genetically determined developmental disorders.Database (Oxford). 2022 Jun 7;2022:baac038. doi: 10.1093/database/baac038. Database (Oxford). 2022. PMID: 35670729 Free PMC article.
References
Publication types
MeSH terms
LinkOut - more resources
Full Text Sources
