. 2021 Aug 7;27(8):gaab050.
doi: 10.1093/molehr/gaab050.

Integrated stress response control of granulosa cell translation and proliferation during normal ovarian follicle development

Affiliations

Integrated stress response control of granulosa cell translation and proliferation during normal ovarian follicle development

Evelyn Llerena Cari et al. Mol Hum Reprod. .

Abstract

Mechanisms that directly control mammalian ovarian primordial follicle (PF) growth activation and the selection of individual follicles for survival are largely unknown. Follicle cells produce factors that can act as potent inducers of cellular stress during normal function. Consistent with this, we show here that normal, untreated ovarian cells, including pre-granulosa cells of dormant PFs, express phenotype and protein markers of the activated integrated stress response (ISR), including stress-specific protein translation (phospho-Serine 51 eukaryotic initiation factor 2α; P-EIF2α), active DNA damage checkpoints, and cell-cycle arrest. We further demonstrate that mRNAs upregulated in primary (growing) follicles versus arrested PFs mostly include stress-responsive upstream open reading frames (uORFs). Treatment of a granulosa cell (GC) line with the PF growth trigger tumor necrosis factor alpha results in the upregulation of a 'stress-dependent' translation profile. This includes further elevated P-eIF2α and a shift of uORF-containing mRNAs to polysomes. Because the active ISR corresponds to slow follicle growth and PF arrest, we propose that repair and abrogation of ISR checkpoints (e.g. checkpoint recovery) drives the GC cell cycle and PF growth activation (PFGA). If cellular stress is elevated beyond a threshold(s) or, if damage occurs that cannot be repaired, cell and follicle death ensue, consistent with physiological atresia. These data suggest an intrinsic quality control mechanism for immature and growing follicles, where PFGA and subsequent follicle growth and survival depend causally upon ISR resolution, including DNA repair and thus the proof of genomic integrity.

Keywords: aging; eukaryotic initiation Factor 2 (EIF2); follicle; integrated stress response; menopause; oocyte; ovary; translational control.


Figures

Figure 1.
Figure 1.
Knowledge gap(s), concepts, and study findings. Ovals represent aging ovaries that contain declining numbers of the reserve of primordial follicles (small circles) over time (double arrow). Primordial follicle growth activation (PFGA) is the commitment of primordial follicles to a growth phase (gray boxes). Growing follicles most often die in a process termed atresia (follicles crossed by ‘X’), and only a small fraction survive to ovulation. The lower grey box shows two adjacent primordial follicles, one that stays growth-arrested, and the other that undergoes PFGA. Mechanisms that control whether individual primordial follicles undergo PFGA or stay arrested, for what can be decades, are mostly unknown (1?). Similarly, mechanisms that select individual growing follicles for death or survival are unclear (2?). Finally, follicle growth is characterized by the slow proliferation of granulosa cells (3?), such that early growth stages are thought to take months (Gougeon, 1986). Factors that enforce this slow growth rate are also mostly unknown. The hypothesis of this study and study findings are summarized at right. We hypothesized that regulation of protein translation by the integrated stress response (ISR; pathway diagram in Supplementary Fig. S1) controls granulosa cell growth and survival. In support of this hypothesis, genes previously identified in large scale studies as associated with human ovarian aging were shown to preferentially contain stress-responsive upstream open reading frames (uORFs), whose action is summarized in the diagram within the blue box. Under conditions of low stress, ribosomes occupy upstream reading frames and translation of the depicted mRNA is inefficient and low. Under conditions of elevated stress, ribosomes ‘skip’ the uORF and more efficiently translate the mRNA’s encoded protein. Activating transcription factor 4 (ATF4) is one well-studied example of translational control by stress and uORFs (Vattem and Wek, 2004). Overall, we found that markers of the activated ISR are present under normal baseline conditions in mouse and human granulosa cells and the pregranulosa cells of primordial follicles. In addition, analysis of genes shown to be involved in PFGA and ovarian aging revealed that uORFs are present and have higher ‘quality scores’ (McGillivray et al., 2018) than found in randomly selected genes. Last, we found that treatment of a mouse granulosa cell line with PFGA activator (Cui et al., 2011; Greenfeld et al., 2007) tumor necrosis factor alpha (Tnfα) resulted in the redistribution of transcripts that contain uORFs to the actively translating polysome subcellular fraction. The data were interpreted as supporting the ISR as a regulator of follicle growth and survival, and potentially PFGA.
Figure 2.
Figure 2.
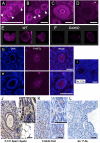
Active ISR marker detection in immature follicles of the mouse and human ovary. (A) Phosphoserine 51-eukaryotic Initiation Factor 2 subunit alpha (P-eIF2α) is detectable via immunofluorescence (purple color is positive signal) in histological preparations of the mouse ovary. PFs are shown in A (arrowheads), primary follicles in (B) (arrowheads), and a small pre-antral follicle is shown in (C). Note that in all cases, both the oocyte and granulosa cells (GCs) exhibit signal; intense punctate staining is visible in some growing oocytes (example in C). A control image where the first antibody to was omitted is shown in (D) (asterisk indicates autofluorescent background) and is the adjacent tissue section to the image shown in C. Three panels are provided in (E) that show wild-type (WT) levels of P-eIF2α for direct comparison with galactose-1-phosphate uridylyltransferase knockout mouse (GalTKO) ovaries in F, images collected using identical settings. (G) and (H) show representative staining for P-eIF2α in immature human follicles from separate patient biopsies (DNA/DAPI, P-eIF2α channels and merged image labeled). (I) is a merged image of DAPI and background staining when first antibody to P-eIF2α is omitted, identical settings as H and I. Panels (J) and (K) show colorimetric staining of mouse ovaries for two DNA damage marks, P-T21 replication protein A2 (Rpa2) and P-S345 checkpoint kinase 1 (Chk1), respectively. Insets show electronically magnified areas that include PFs. Panel (L) is a no 1st antibody control. Scale bars for Panels A–D = 100, G–I = 20 and J–L = 75 μm, respectively.
Figure 3.
Figure 3.
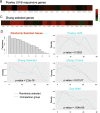
Gene expression and uORF analysis of control cell and GC gene sets.  Zhang et al. (2018) gene expression data were explored and comparative expression of ISR machinery and DNA repair genes between PF and primary follicle GCs was determined (A). Heme-regulated inhibitor (HRI/EIF2AK1), protein kinase RNA-activated (PKR/EIF2AK2), protein kinase, DNA-activated, catalytic subunit (DNAPk-cs/PRKDC), ataxia telangiectasia mutated (ATM), ataxia telangiectasia and rad3 related (ATR), and X-ray repair cross complementing 1 (XRCC1) were all significantly higher in primary GCs. Data in panel A graphs are summarized as a heatmap immediately below, with the log (Base 2) ratio of expression in primary GCs to PF GCs depicted. (B) shows a heatmap generated as in (A) of the Powley UVB-responsive gene set, and Panel (C) is a heatmap of the same expression ratio for the Zhang selected GC gene set. (D) is a comparison of Gerstein uORFs quality scores between the selected gene sets and randomly selected genes. Histograms of uORF score frequencies were prepared for a set of randomly selected genes (top left) and each of the previously evaluated gene sets (Powley, Zhang selected, Zhang criteria, and Day ANM: age of natural menopause). Density plots reveal that in each case, a rightward ‘shift’ in uORF scores is present (blue) compared to randomly selected genes (red). In the cases of Powley UVB, Zhang selected GC, and Day ANM gene sets, a high score ‘bump’ where uORF scores within a particular range are over-represented is detectable compared to randomly selected genes. These shifts correspond directly to increased mean HiQ uORF scores for each gene set (Table II). P values shown comparing uORF densities were calculated using the Kolmogorov–Smirnov test.
Figure 3.
Figure 3.
Continued.
Figure 4.
Figure 4.
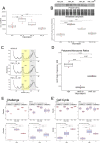
ISR activation in a murine granulosa cell line using Tnf α  results in stimulated growth and an altered translational profile that corresponds to uORF content. To establish a model of GC ISR activation, we treated OV3121 cells with a dose curve of Tnfα (Tnfα at 10 ng/ml is labeled TNF_10; 20 ng/ml, TNF_20; and 50 ng/ml, TNF_50) or vehicle (VEH) and evaluated cell growth 24H post-treatment
Figure 4.
Figure 4.
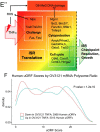
Continued by direct cell counts (A) and with a fluorescent assay (Supplementary Fig. S4A). In each case, 10 ng/ml Tnfα stimulated cell growth 24 H post-treatment, 20 ng/ml resulted in no net change in cell number (Panel A, Supplementary Fig. S4A), and 50 ng/ml resulted in a significant reduction in cell number (A). Panel (B) shows that 10 ng/ml Tnfα significantly increases Ser51 P-eIF2α at 4 and 8 h (H) compared to cells collected 4H post-VEH (asterisk * indicates that two replicates were performed for 16H time point instead of three as in other cases). Panels (C) and (D) show normalized ribosomal fractionation traces and corresponding Polysome: Monosome ratios for two OV3121 cell replicates treated with VEH or 10 ng/ml Tnfα for 3 or 12 H. Areas under the curve for POLY(some) and 80S regions indicated in C were used to calculate ratios in D. Plots in (E) are representative examples of Nanostring quantification of mRNAs in SUB (polysomal) versus POLY fractions in (C). POLY: SUB deltas were determined by calculating the ratio between the POLY:SUB ratio for 3 h Tnfα treatment and VEH-treated cells. Sub-panels in Fig. 4E denote functional gene groups, and sub-panel 4E”’ is a data summary where mRNAs are organized by function and threshold ISR activity is indicated by the dashed vertical line. Panel (F) shows a summary density plot of Gerstein uORF quality scores for human mRNAs whose mouse orthologues are enriched (UP) in OV3121 polysome fractions 3H post-Tnfα compared to those that are diminished (DOWN) in polysomes. P values for A, B, D and E were determined using Welch’s t test, for F, the Kolmogorov–Smirnov test.
Figure 5.
Figure 5.
Integrated stress response checkpoint resolution as a trigger of the GC cell cycle and PF growth activation. Box 1 depicts fluctuating ISR activity over time, as controlled by levels physiological stressors. As long as the ISR is active/high (red double-headed arrow), GC stay growth-arrested. Box 2 depicts the action of an acute stressor (red lightning bolt; e.g. by local elevation of an ISR activating factor such as Tnfα (Chen et al., 1993)) that initially elevates ISR activity. In response, the cell upregulates the expression of stress-resolving damage repair genes at the level of ISR translational control (asterisk; Fig. 4, Supplementary Fig. S4C–E). Cellular repair activity then increases, and net ISR activity declines. Increased translation of positive cell cycle regulators including G1 cyclins and CDK6 also occurs at this time. If ISR activity declines beneath a threshold (horizontal dashed line), ISR checkpoint resolution can occur and the cell can enter the cell cycle Box 3. In pregranulosa cells of primordial follicles, ISR checkpoint resolution would correspond to PFGA. How oocyte: granulosa cell interactions contribute to ISR action in this model is an open question.

Comment in

Similar articles

Cited by

References

    1. Amargant F, Manuel SL, Tu Q, Parkes WS, Rivas F, Zhou LT, Rowley JE, Villanueva CE, Hornick JE, Shekhawat GS. et al. Ovarian stiffness increases with age in the mammalian ovary and depends on collagen and hyaluronan matrices. Aging Cell 2020;19:e13259. - PMC - PubMed
    1. Ba X, Bacsi A, Luo J, Aguilera-Aguirre L, Zeng X, Radak Z, Brasier AR, Boldogh I. 8-Oxoguanine DNA glycosylase-1 augments proinflammatory gene expression by facilitating the recruitment of site-specific transcription factors. J Immunol 2014;192:2384–2394. - PMC - PubMed
    1. Balakrishnan B, Nicholas C, Siddiqi A, Chen W, Bales E, Feng M, Johnson J, Lai K. Reversal of aberrant PI3K/Akt signaling by Salubrinal in a GalT-deficient mouse model. Biochim Biophys Acta Mol Basis Dis 2017;1863:3286–3293. - PubMed
    1. Balakrishnan B, Siddiqi A, Mella J, Lupo A, Li E, Hollien J, Johnson J, Lai K. Salubrinal enhances eIF2alpha phosphorylation and improves fertility in a mouse model of Classic Galactosemia. Biochim Biophys Acta Mol Basis Dis 2019;1865:165516. - PMC - PubMed
    1. Barbosa C, Peixeiro I, Romão L. Gene expression regulation by upstream open reading frames and human disease. PLoS Genet 2013;9:e1003529. - PMC - PubMed

Publication types