. 2021 Jul 27;118(30):e2023739118.
doi: 10.1073/pnas.2023739118.

Treg-expressed CTLA-4 depletes CD80/CD86 by trogocytosis, releasing free PD-L1 on antigen-presenting cells

Affiliations

Treg-expressed CTLA-4 depletes CD80/CD86 by trogocytosis, releasing free PD-L1 on antigen-presenting cells

Murat Tekguc et al. Proc Natl Acad Sci U S A. .

Abstract

Foxp3-expressing CD4+CD25+ regulatory T cells (Tregs) constitutively and highly express the immune checkpoint receptor cytotoxic T-lymphocyte-associated antigen-4 (CTLA-4), whose Treg-specific deficiency causes severe systemic autoimmunity. As a key mechanism of Treg-mediated suppression, Treg-expressed CTLA-4 down-regulates the expression of CD80/CD86 costimulatory molecules on antigen-presenting cells (APCs). Here, we show that Treg-expressed CTLA-4 facilitated Treg-APC conjugation and immune synapse formation. The immune synapses thus formed provided a stable platform whereby Tregs were able to deplete CD80/CD86 molecules on APCs by extracting them via CTLA-4-dependent trogocytosis. The depletion occurred even with Tregs solely expressing a mutant CTLA-4 form lacking the cytoplasmic portion required for its endocytosis. The CTLA-4-dependent trogocytosis of CD80/CD86 also accelerated in vitro and in vivo passive transfer of other membrane proteins and lipid molecules from APCs to Tregs without their significant reduction on the APC surface. Furthermore, CD80 down-regulation or blockade by Treg-expressed membrane CTLA-4 or soluble CTLA-4-immunoglobulin (CTLA-4-Ig), respectively, disrupted cis-CD80/programmed death ligand-1 (PD-L1) heterodimers and increased free PD-L1 on dendritic cells (DCs), expanding a phenotypically distinct population of CD80lo free PD-L1hi DCs. Thus, Tregs are able to inhibit the T cell stimulatory activity of APCs by reducing their CD80/CD86 expression via CTLA-4-dependent trogocytosis. This CD80/CD86 reduction on APCs is able to exert dual suppressive effects on T cell immune responses by limiting CD80/CD86 costimulation to naïve T cells and by increasing free PD-L1 available for the inhibition of programmed death-1 (PD-1)-expressing effector T cells. Blockade of CTLA-4 and PD-1/PD-L1 in combination may therefore synergistically hinder Treg-mediated immune suppression, thereby effectively enhancing immune responses, including tumor immunity.

Keywords: CD80/CD86; CTLA-4; PD-L1; regulatory T cells; trogocytosis.


Conflict of interest statement

Competing interest statement: Authors S.S., J.B.W., and the reviewer M.K.L. contributed independently as coauthors to guideline mega-studies, which were published as A. Cossarizza et al., Eur. J. Immunol. 47, 1584–1797 (2017); A. Fuchs et al., Front. Immunol. 8, 1–15 (2018); and A. Cossarizza et al., Eur. J. Immunol. 49, 1457–1973 (2019).

Figures
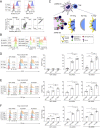
Fig. 1.
Fig. 1.
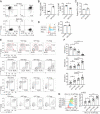
Uptake of CD80/CD86 proteins and accompanying DC membrane fragments by Tregs via CTLA-4–dependent trogocytosis. (A) Expression and cycling patterns of Treg-expressed CTLA-4. (Upper) Live/Dead-dyeCD4+CD25+Foxp3+ cells were stained separately for surface and total-CTLA-4 at 4 °C. (Lower) Single-stained Tregs solely with the primary antibody represent the cycling CTLA-4 at 37 °C while Tregs labeled with both primary and secondary antibodies at 4 °C display the noncycling surface CTLA-4. KO and WT Tregs were purified from the spleens and peripheral lymph nodes of the same female CTLA-4flox/flox, Foxp3IRES-Cre heterozygous, and Rosa-RFP-Cre reporter mice while TL Tregs were simultaneously sorted from female TLC4Tg mice. The mice used were all on the BALB/c background. Data are representative of two independent experiments. (B) GFP, CD80, and CD86 expression of GFP-, 80-, and 86-JAWSII DCs. A total of 5 × 10⁴ JAWSII DCs (on the C57BL/6 background) were stimulated in the presence of 0.1 μg/mL LPS at 37 °C for 20 h. Data are representative of four independent experiments. (C) Experimental illustration for Treg-JAWSII DC coculture assays. GFP-, 80-, or 86-JAWSII DCs (3 × 10⁴), labeled with lipophilic DiD dye, were incubated at a 1:2 ratio with purified KO, WT, or TL Tregs in the presence of anti-CD3e (0.5 μg/mL), IL-2 (100 IU), GM-CSF (5 ng/mL), and LPS (0.1 μg/mL) at 37 °C for 20 h. Cocultured Tregs were pregated on single Live/Dead-dyeCD4+CD25+ cells. Transfer of proteins and lipids by Tregs from DCs was based on Treg expression of GFP, DiD dye, and CD11b. (D) Uptake of CD80- or CD86-GFP fusion protein by Tregs (n = 8). (E) Uptake of lipophilic DiD dye by Tregs from labeled JAWSII DCs (n = 4). Fluorescence minus one (FMO) staining control displays WT Tregs cultured with unlabeled JAWSII DCs. (F) Uptake of DC surface protein CD11b by Tregs (n = 4). The staining control shows WT Tregs incubated alone. Histogram in D is representative of eight independent experiments; histogram in E and F of four independent experiments. Numbers on histograms in A and DF show the percent positive values. Means ± SEM. Asterisks indicate P values derived from one-way ANOVA with Tukey’s multiple comparisons test (*P ≤ 0.05, **P ≤ 0.01, ***P ≤ 0.001, ****P ≤ 0.0001); ns, not significant.
Fig. 2.
Fig. 2.
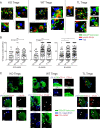
CTLA-4–dependent conjugate formation of Tregs and APCs. (A) Formation of Treg-JAWSII DC conjugates defined as CD4+CD11b+ doublets. These doublets were pregated on total Live/Dead-dye cells, representative of four independent experiments. GFP-, 80-, or 86-JAWSII DCs were cocultured at a 1:2 ratio for 20 h with Tregs purified from CRF and C4TLTG mice as in Fig. 1. (B) Summary of the quantified Treg-JAWSII conjugates (n = 4). (C and D) A total of 1 × 10⁵ B cells, from WT mice, were cocultured with purified Tregs at designated ratios in the presence of anti-CD3e (0.5 μg/mL), IL-2 (100 IU), and LPS (10 μg/mL) for 72 h. (C) Generation of Treg-B cell conjugates defined as CD4+CD45R+ doublets pregated on total Live/Dead-dye cells. Data are representative of three independent experiments. (D) Summary of the quantified Treg-B cell conjugates at various ratios (n = 3), from three independent experiments. Means ± SEM. Asterisks in B and D indicate P values derived from one-way ANOVA and two-way ANOVA with Tukey’s multiple comparisons test, respectively (*P ≤ 0.05, **P ≤ 0.01, ***P ≤ 0.001, ****P ≤ 0.0001); ns, not significant.
Fig. 3.
Fig. 3.
Visualization of Treg-DC immune synapses as platforms for CTLA-4–dependent trogocytosis. (A) Live-cell imaging of Treg-JAWSII DC conjugates by confocal microscopy. Purified Tregs (prepared as shown in Fig. 1) and stained with cytoplasmic CellTracker blue dye, were incubated at a 1:1 ratio with the DiD dye-labeled JAWSII DCs (5 × 10⁴) for 16 h. White arrows in the representative slides show the capture of CD80-GFP and/or lipid particles by Tregs prepared as shown in Fig. 1. (Scale bar, 5 µm.) (B) Enumeration of the contacts between Tregs and JAWSII DCs. Each symbol in the graphs denotes the ratio of Tregs, in contact with DCs, among the whole Treg population per slide (0.01 mm2). Data are pooled from four mice, representative of four independent experiments. Asterisks indicate P values derived from one-way ANOVA with Tukey’s multiple comparisons test (*P ≤ 0.05, ****P ≤ 0.0001); ns, not significant. (C) Colocalization of polarized CTLA-4 with CD80-GFP aggregates at Treg-JAWSII DC contact sites. Sorted WT, KO, and TL Tregs (5 × 10⁴ cells) were cocultured at a 2:1 ratio with JAWSII DCs for 16 h. CTLA-4 (red) and LFA-1 (blue) were labeled by antibody staining following the fixation of cells. The white arrowheads mark the contact sites of JAWSII DCs and Tregs. Data are representative of two independent experiments. (Scale bar, 5 µm.)
Fig. 4.
Fig. 4.
In vitro Treg-suppressive activity correlated with the degree of CD80/CD86 deprivation from B cells as APCs. (A) Expression of CD80 by LPS-activated B cells cultured with TL or WT Tregs at various ratios. Numbers on histograms display both CD80 MFI of B cells (Left) and the percentages of CD80+ B cells (Right) (n = 4). TL or WT Tregs from TLC4Tg or WT mice, prepared as shown in Fig. 1, were incubated with B cells (1 × 10⁵/well) at varying ratios in the presence of anti-CD3e, IL-2, and LPS for 72 h. LPS-activated B cells were pregated on single Live/Dead-dyeCD4CD45R+ cells. (B) Expression of CD86 by LPS-activated B cells cultured with TL or WT Tregs at various ratios as shown in A. Numbers on histograms display CD86 MFI of B cells (n = 4). Data in A and B are representative of four independent experiments. (C) Suppressive capacity of TL and WT Tregs. A total of 1 × 10⁵ CD4+ Tconvs labeled with CellTrace Violet (CTV) dye and the same number of B cells were cocultured with purified TL or WT Tregs at various Treg/Tconv ratios in the presence of anti-CD3e (0.5 μg/mL) for 72 h. Numbers on histograms show the percentages of divided Tconv cells (n = 4), representative of four independent experiments. Means ± SEM. Asterisks indicate P values derived from two-way ANOVA with Sidak’s multiple comparisons test (***P ≤ 0.001, ****P ≤ 0.0001); ns, not significant.
Fig. 5.
Fig. 5.
Adoptively transferred Tregs and Tconvs passively acquire CD45.1 from host cells in a CTLA-4–dependent manner. (A) Schematic representation and the gating strategy of adoptively transferred Tregs. KO and WT Tregs (1 × 10⁵), sorted from the same female CRF mice, were injected intravenously into CD45.1 RAG2 KO mice together with 1 × 10⁶ CD45RCD4+CD25 Tconvs from CD45.1 mice. All mice were on the BALB/c background. Spleens of the recipient mice were collected on day 28. CD4+ T cells pregated as Live/Dead-dyeCD8CD11bNKp46CD45RCD11cCD45.2+CD3+CD4+ cells were analyzed. WT Tregs were further classified as CTLA-4lo and CTLA-4hi Tregs. (B) Uptake of CD45.1 protein by adoptively transferred Tregs. The graphs show CD45.1 MFI values of Tregs from 17 mice in three independent experiments. (C) Schematic representation and the gating strategy of adoptively transferred CD4+ T cells. A total of 1 × 10⁶ CD45RCD4+ T cells purified from CRF mice were adoptively transferred intravenously into CD45.1 RAG2 KO mice and analyzed on day 28. They were classified as CTLA-4 and CTLA-4+ Tconvs, which were further dissected into CTLA-4lo and CTLA-4hi Tconvs. (D) Uptake of CD45.1 protein by adoptively transferred Tconvs. The graphs show CD45.1 MFI values of Tconvs from 23 mice in five independent experiments. Asterisks in B and D indicate P values derived from two-tailed paired t test (***P ≤ 0.001, ****P ≤ 0.0001).
Fig. 6.
Fig. 6.
Treg-dependent depletion of CD80 increases free PD-L1 on DCs and converts them into CD80lo free PD-L1hi DCs. (A) Up-regulation of free PD-L1 on CD80−/−CD86−/− DKO DCs. Following the purification of CD3CD19CD11c+CD80+ WT and CD3CD19CD11c+ DKO splenic DCs from WT and DKO C57BL/6 mice, respectively, 5 × 10⁴ DCs/well were stimulated at 37 °C for 12 h in the presence of GM-CSF (10 ng/mL) and LPS (0.1 μg/mL). DCs were first labeled with biotinylated 1-111A anti–PD-L1, then stained with streptavidin, 10F.9G2 anti–PD-L1, anti–CD11c, anti–CD80, and analyzed by flow cytometry. DCs in the graphs were pregated as single Live/Dead-dyeCD11c+ cells. (B) Free PD-L1 expression (revealed by 10F.9G2 anti–PD-L1 mAb) and total-PD-L1 expression (revealed by 1-111A anti–PD-L1 mAb) by WT and DKO DCs (n = 4). (C) PD-L1 mRNA expression of LPS and GM-CSF stimulated WT and DKO DCs by qRT-PCR (n = 3). (D) PD-L2 expression by WT and DKO splenic DCs. Numbers on histograms show percentages of PD-L2hi DCs (n = 4). (E) CD80, free PD-L1 (10F.9G2), total-PD-L1 (1-111A), PD-L2, and MHC-II expression by splenic DCs cocultured with KO, TL, or WT Tregs. Splenic DCs (5 × 10⁴ cells/well) purified from WT BALB/c mice as in A were cocultured with KO, TL, or WT Tregs (from BALB/c CRF and C4TLTG mice) at a 1:1 ratio in the presence of anti-CD3e (0.5 μg/mL), recombinant IL-2 (100 IU), GM-CSF (10 ng/mL), and LPS (0.1 μg/mL) for 12 h and then stained as in A. Fractions A–C in the first row were described based on the expression levels of CD80 and free PD-L1 (10F.9G2). Gating of PD-L1 (1-111A), PD-L2, and MHC-II staining indicates PD-L1 (1-111A)lo/(1-111A)hi, PD-L2hi, and MHC-IIhi DCs, respectively. (F) The ratios of fractions A–C among DCs cocultured with KO, TL, or WT Tregs (n = 11). (G) Free PD-L1 (10F.9G2) expression by total-PD-L1 (1-111A)hi DCs shown in E and F. Data in AG are representative of two to four independent experiments. Asterisks in BD indicate P values derived from two-tailed paired t test. Asterisks in F and G indicate P values derived from one-way ANOVA with Dunnett’s multiple comparisons test. (*P ≤ 0.05, **P ≤ 0.01, ***P ≤ 0.001, ****P ≤ 0.0001); ns, not significant.
Fig. 7.
Fig. 7.
Solubilized CTLA-4 releases free PD-L1 by blockade of CD80 on DCs. (A and B) The effect of CD80 blockade on free PD-L1 expression by WT splenic DCs. Numbers on the Left of histograms in B display CD80 MFI values, while percentages of free PD-L1 (10F.9G2)hi DCs are shown on the Right. CD3CD19CD11c+CD80+ WT C57BL/6 splenic DCs (5 × 10⁴ cells/well) were stimulated at 37 °C for 12 h with GM-CSF (10 ng/mL) and LPS (0.1 μg/mL) in the presence of CTLA-4 Ig, isotype Ig, anti-CD80, or anti-CD86 antibody. CTLA-4-immunoglobulin (CTLA-4-Ig) was added at the concentrations of 0.5 or 2.5 μg/mL and other antibodies at 2.5 μg/mL. The cultured DCs were stained with anti–PD-L1 (clone 10F.9G2), anti-CD11c, anti-CD80, and anti–PD-L2 for flow cytometry analysis. DCs in the graphs were pregated as single Live/Dead-dyeCD11c+ cells. (C) Summary of the effects of CD80 blockade on free PD-L1 expression by WT splenic DCs as MFIs and percentages of free PD-L1hi DCs (n = 4). (D) PD-L1 mRNA expression by LPS and GM-CSF stimulated splenic DCs treated with CTLA-4 Ig (n = 3). (E) Expression of PD-L2 by WT splenic DCs treated as indicated. Numbers on histograms show percentages of PD-L2hi DCs (n = 4). Data in AE are representative of two independent experiments. Means ± SEM. Asterisks in C and E indicate P values derived from one-way ANOVA with Dunnett’s multiple comparisons test. (*P ≤ 0.05, **P ≤ 0.01, ***P ≤ 0.001, ****P ≤ 0.0001); ns, not significant. P value in D is derived from a two-tailed paired t test.

Similar articles

Cited by

References

    1. Sakaguchi S., et al. ., Regulatory T cells and human disease. Annu. Rev. Immunol. 38, 541–566 (2020). - PubMed
    1. Read S., Malmström V., Powrie F., Cytotoxic T lymphocyte-associated antigen 4 plays an essential role in the function of CD25(+)CD4(+) regulatory cells that control intestinal inflammation. J. Exp. Med. 192, 295–302, 10.1084/jem.192.2.295 (2000). - DOI - PMC - PubMed
    1. Salomon B., et al. ., B7/CD28 costimulation is essential for the homeostasis of the CD4+CD25+ immunoregulatory T cells that control autoimmune diabetes. Immunity 12, 431–440 (2000). - PubMed
    1. Takahashi T., et al. ., Immunologic self-tolerance maintained by CD25(+)CD4(+) regulatory T cells constitutively expressing cytotoxic T lymphocyte-associated antigen 4. J. Exp. Med. 192, 303–310 (2000). - PMC - PubMed
    1. Wing K., et al. ., CTLA-4 control over Foxp3+ regulatory T cell function. Science 322, 271–275 (2008). - PubMed

Publication types

LinkOut - more resources