. 2021 Oct;31(10):1867-1884.
doi: 10.1101/gr.271205.120. Epub 2021 Jul 22.

A graph neural network model to estimate cell-wise metabolic flux using single-cell RNA-seq data

Affiliations

A graph neural network model to estimate cell-wise metabolic flux using single-cell RNA-seq data

Norah Alghamdi et al. Genome Res. 2021 Oct.

Abstract

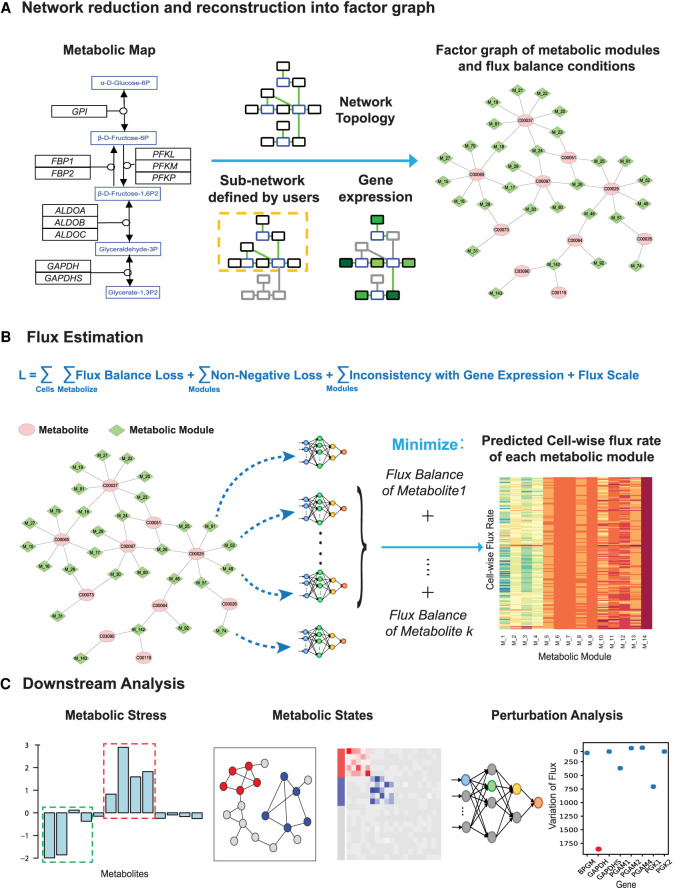
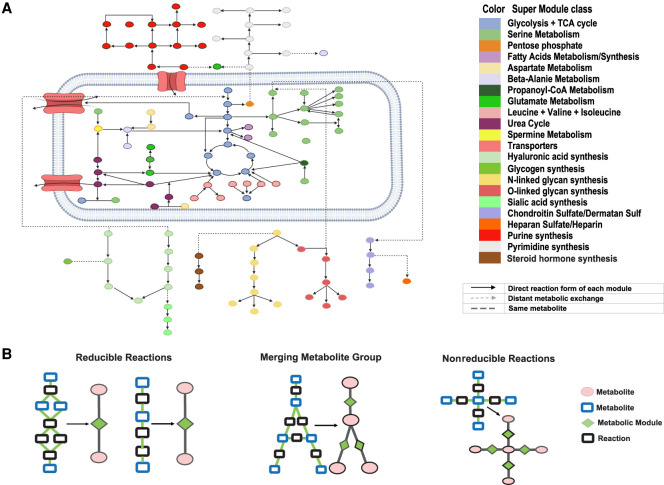
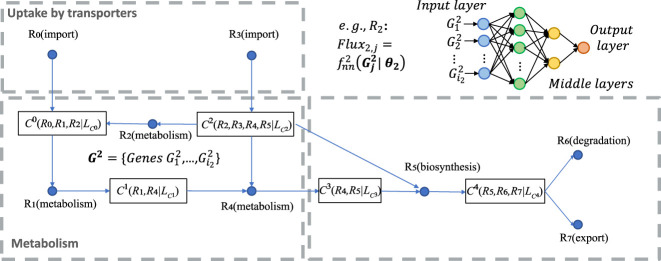
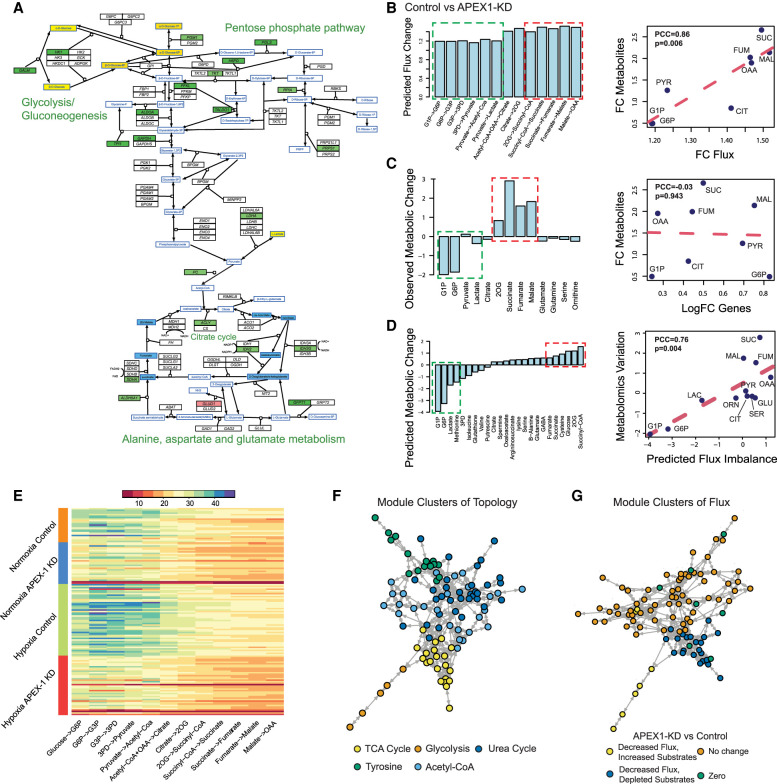
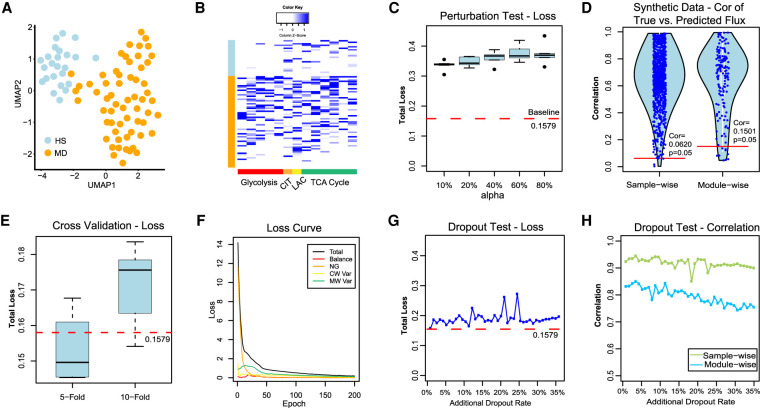
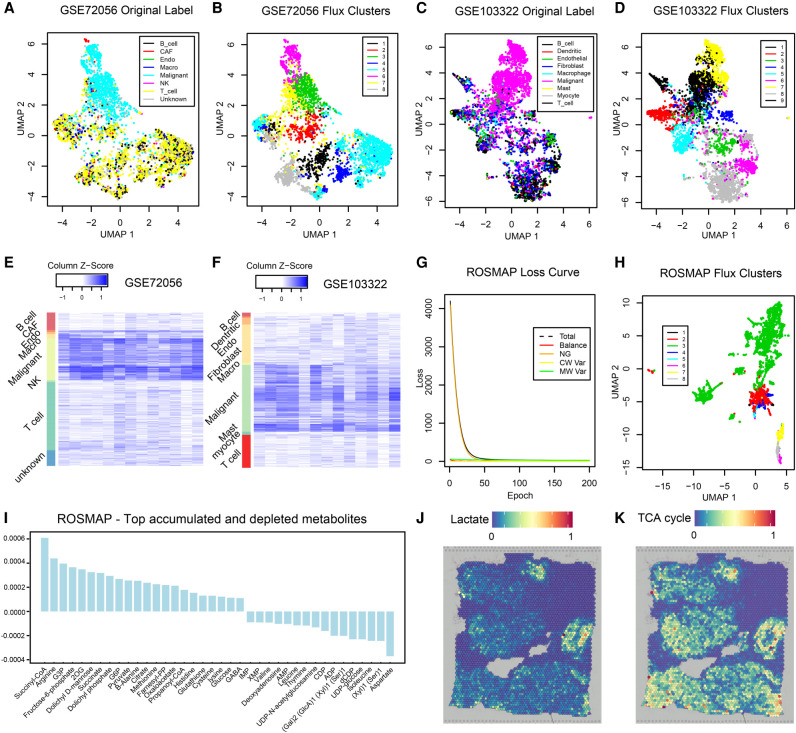
The metabolic heterogeneity and metabolic interplay between cells are known as significant contributors to disease treatment resistance. However, with the lack of a mature high-throughput single-cell metabolomics technology, we are yet to establish systematic understanding of the intra-tissue metabolic heterogeneity and cooperative mechanisms. To mitigate this knowledge gap, we developed a novel computational method, namely, single-cell flux estimation analysis (scFEA), to infer the cell-wise fluxome from single-cell RNA-sequencing (scRNA-seq) data. scFEA is empowered by a systematically reconstructed human metabolic map as a factor graph, a novel probabilistic model to leverage the flux balance constraints on scRNA-seq data, and a novel graph neural network-based optimization solver. The intricate information cascade from transcriptome to metabolome was captured using multilayer neural networks to capitulate the nonlinear dependency between enzymatic gene expressions and reaction rates. We experimentally validated scFEA by generating an scRNA-seq data set with matched metabolomics data on cells of perturbed oxygen and genetic conditions. Application of scFEA on this data set showed the consistency between predicted flux and the observed variation of metabolite abundance in the matched metabolomics data. We also applied scFEA on five publicly available scRNA-seq and spatial transcriptomics data sets and identified context- and cell group-specific metabolic variations. The cell-wise fluxome predicted by scFEA empowers a series of downstream analyses including identification of metabolic modules or cell groups that share common metabolic variations, sensitivity evaluation of enzymes with regards to their impact on the whole metabolic flux, and inference of cell-tissue and cell-cell metabolic communications.


Figures

Figure 1.
Figure 1.
The computational framework of scFEA. (A) Metabolic reduction and reconstruction. A metabolic map was reduced and reconstructed into a factor graph based on network topology, significantly non-zero gene expressions, and users’ input. (B) A novel graph neural network architecture–based prediction of the cell-wise fluxome. A loss function (L) composed by loss terms of flux balance, non-negative flux, coherence between predicted flux and gene expression, and constraint of flux scale, were used to estimate cell-wise metabolic flux from scRNA-seq data. See detailed models and formulations in Results and Methods. (C) Downstream analysis of scFEA is provided, including inference of metabolic stress, cell and module clusters of distinct metabolic states, and the genes of the top impact to the whole metabolic flux.
Figure 2.
Figure 2.
Reduced and reconstructed human metabolic map. (A) Collected human metabolic modules and supermodule classes. (B) Examples of how the network motifs in the metabolic map are simplified into metabolic modules, where the reactions and metabolites are represented by black and blue rectangles, and modules and metabolites are colored by green and pink. Chainlike reactions can be directly simplified; a complicated module connected by multiple branches can be shrunk into one point linked with the multiple in/out branches; and complicated intersections cannot be simplified.
Figure 3.
Figure 3.
A toy model of the factor graph of metabolic modules, flux balance conditions, and the flux model for the module R2 (top right). In the factor graph, each C (metabolites) corresponds to one flux balance condition and serves as a factor, and each R (can be a reaction or a module) is a variable. For example, C0(R0,R1,R2|Lc0) simply represents that the metabolite C0 is determined by the flux balance loss of R0, R1, R2, where Lc0 is the flux balance term of C0. Import and export/degradation reactions are considered as having no input or output substrates.
Figure 4.
Figure 4.
Application of scFEA on matched scRNA-seq and metabolomics data of Pa03C cells. (A) Gene expression and metabolomic variations of the glycolysis, pentose phosphate, TCA cycle, glutamine, and aspartate metabolic pathways in APEX1-KD versus control under normoxia condition. Genes/metabolites are shown in rectangular boxes with black/blue borders, up-regulated/down-regulated genes are colored in red/green, increased and decreased metabolites are colored in yellow/blue, respectively. The darker color suggests a higher variation. (B) Predicted flux fold change (left, x-axis: metabolic module, y-axis: predicted flux change) in control versus APEX1-KD, and correlation between fold change of predicted flux and observed metabolite change (right, x-axis: fold change of predicted flux, y-axis: fold change of observed metabolite abundance, each data point is one metabolite). (PYR) pyruvate; (CIT) citrate; (FUM) fumarate; (SUC) succinate; (MAL) malate. (C) Observed metabolomic change (left, x-axis: metabolites, y-axis: abundance difference observed in the metabolomics data) in control versus APEX1-KD, and correlation between log fold change of gene expressions involved in each reaction and observed metabolomics change (right, x-axis: log fold change of the averaged expression of the genes involved in each reaction, y-axis: fold change of observed metabolites abundance observed in the metabolomics data, each data point is one metabolite). (D) Predicted metabolic stress (left, x-axis: metabolites, y-axis: predicted abundance difference) in control versus APEX1-KD and correlation between predicted metabolic stress and observed difference in metabolite abundance (right, x-axis: top scFEA-predicted imbalance of the influx/outflux of intermediate metabolites, y-axis: difference of observed metabolomic abundance, in control versus APEX1-KD, each data point is one metabolite: (LAC) lactate; (SER) serine; (GLU) glutamine; (ORN) ornithine. In B–D, all comparisons were made by comparing control versus APEX1-KD under normoxia. The fold change of metabolomic abundance is used in calculating the correlation in BC and difference of metabolomic abundance is used in D. The green and red dashed blocks represents the accumulated (green) and depleted (red) metabolites in Control versus APEX1-KD. (E) Profile of the predicted fluxome of 13 glycolytic and TCA cycle modules. Here, each column represents the flux between two metabolites (shown on the x-axis) for all the cells of the four experimental conditions (shown on the y-axis). For two neighboring fluxes, the product of the reaction on the left is the substrate of the reaction on the right, and in a perfectly balanced flux condition, the two neighboring fluxes should be equal. (F) Clusters of metabolic modules inferred by using the network connectivity structure only. (G) Clusters of metabolic modules inferred by using the network topological structure (weight of 0.3) combined with the predicted fluxome (weight of 0.7).
Figure 5.
Figure 5.
Method validations on real-world and synthetic data sets. (A) UMAP-based clustering visualization of the GSE132581 PV-ADSC data, in which HS and MD stand for PV-ADSC of HS and more differentiation, respectively. (B) Distribution of predicted cell-wise flux of glycolytic and TCA cycle modules. Each row is one cell, and row side color bar represents HS and MD PV-ADSC by blue and orange, respectively. Each column is one module. The left five columns (red) are glycolytic modules from glucose to acetyl-CoA, the CIT column (orange) is the reaction from acetyl-CoA to Citrate, the LAC column (yellow) is the reaction from pyruvate to lactate, and the right six columns (green) are TCA cycle modules from citrate to oxaloacetic acid. (C) The total loss (y-axis) for cases in which different proportion (x-axis) of cell samples have randomly shuffled gene expressions of the pancreatic cancer cell line data. The baseline loss 0.1579 was computed using the original expression profile of all 166 cells. (D) The sample-wise and module-wise correlation (y-axis) between the true and predicted module flux in synthetic data-based method validation with multiple repetitions, in which Cor = 0.5775 (P = 0.05) and 0.5778 (P = 0.05) correspond to the sample-wise and module-wise correlation, respectively. (E) Total loss (y-axis) computed under 5-fold/10-fold cross-validation (x-axis) versus baseline loss. (F) Convergency of the total loss and four loss terms during the training of neural networks on the pancreatic cancer cell line data. (G) Total loss (y-axis) computed from the robustness test by adding 0%–35% artificial dropouts to the original data (50.22% zero rate) versus baseline loss. (H) Sample-wise and module-wise correlation (y-axis) of the module flux predicted from the data with 0%–35% additional artificial dropouts with the module flux predicted from the original data.
Figure 6.
Figure 6.
Application on two tumor scRNA-seq data sets, ROSMAP, and one breast cancer spatial transcriptomics data set. (A) UMAP-based clustering visualization using predicted metabolic fluxes of the GSE72056 melanoma data; the cell label was provided in the original work (Tirosh et al. 2016). (B) UMAP-based clustering visualization using predicted metabolic fluxes of the GSE72056; k-means clustering was used for cell clustering. (C) UMAP-based clustering visualization using predicted metabolic fluxes of the GSE103322 head and neck cancer data; the cell label was provided in the original work (Puram et al. 2017). (D) UMAP-based clustering visualization using predicted metabolic fluxes of the GSE103322; k-means clustering was used for cell clustering. (E) Distribution of predicted cell-wise flux of glycolytic and TCA cycle modules of GSE72056 melanoma data. Each row is one cell, and row side color bar represents eight cell types. Each column is one module. The left five columns are glycolytic modules from glucose to acetyl-CoA, the sixth column is the reaction from acetyl-CoA to Citrate, the seventh column is the reaction from pyruvate to lactate, and the right-most six columns (columns 8–13) are TCA cycle modules from citrate to oxaloacetic acid. (F) Distribution of predicted cell-wise flux of glycolytic and TCA cycle modules of GSE103322 head and neck cancer data. Each row is one cell, and row side color bar represents nine cell types, respectively. The columns are the same as E. (G) UMAP-based clustering visualization using predicted metabolic fluxes of the ROSMAP data; k-means clustering was used for cell clustering. (H) Convergency curve of the total loss and four loss terms during the training of neural networks on the ROSMAP data. (I) Top accumulated and depleted metabolites predicted in the AD neuron cells in the ROSMAP data. The y-axis is metabolism stress level (or level of accumulation and depletion), where a positive value represents accumulation and a negative value represents depletion. The x-axis are metabolites in a decreasing order of the accumulation level. (J) scFEA-predicted flux rate of lactate product on the spatial breast cancer data. The color of each point represents the spatial-wise predicted lactate product rate. The spatial plot is overlaid on the tissue slice image. (K) scFEA-predicted flux rate of TCA cycle (citrate to 2OG) on the spatial breast cancer data.

Similar articles

Cited by

References

    1. Ahl PJ, Hopkins RA, Xiang WW, Au B, Kaliaperumal N, Fairhurst AM, Connolly JE. 2020. Met-Flow, a strategy for single-cell metabolic analysis highlights dynamic changes in immune subpopulations. Commun Biol 3: 305. 10.1038/s42003-020-1027-9 - DOI - PMC - PubMed
    1. Ali A, Abouleila Y, Shimizu Y, Hiyama E, Emara S, Mashaghi A, Hankemeier T. 2019. Single-cell metabolomics by mass spectrometry: advances, challenges, and future applications. Trends Analyt Chem 120: 115436. 10.1016/j.trac.2019.02.033 - DOI
    1. Atamna H, Frey WH II. 2007. Mechanisms of mitochondrial dysfunction and energy deficiency in Alzheimer's disease. Mitochondrion 7: 297–310. 10.1016/j.mito.2007.06.001 - DOI - PubMed
    1. Bhutia YD, Babu E, Ramachandran S, Yang S, Thangaraju M, Ganapathy V. 2016. SLC transporters as a novel class of tumour suppressors: identity, function and molecular mechanisms. Biochem J 473: 1113–1124. 10.1042/BJ20150751 - DOI - PMC - PubMed
    1. Bishop AL, Rab FA, Sumner ER, Avery SV. 2007. Phenotypic heterogeneity can enhance rare-cell survival in ‘stress-sensitive’ yeast populations. Mol Microbiol 63: 507–520. 10.1111/j.1365-2958.2006.05504.x - DOI - PubMed

Publication types

LinkOut - more resources