. 2021 Sep 6;218(9):e20210108.
doi: 10.1084/jem.20210108. Epub 2021 Jul 23.

Anti-tumor immunity in mismatch repair-deficient colorectal cancers requires type I IFN-driven CCL5 and CXCL10

Affiliations

Anti-tumor immunity in mismatch repair-deficient colorectal cancers requires type I IFN-driven CCL5 and CXCL10

Courtney Mowat et al. J Exp Med. .

Abstract

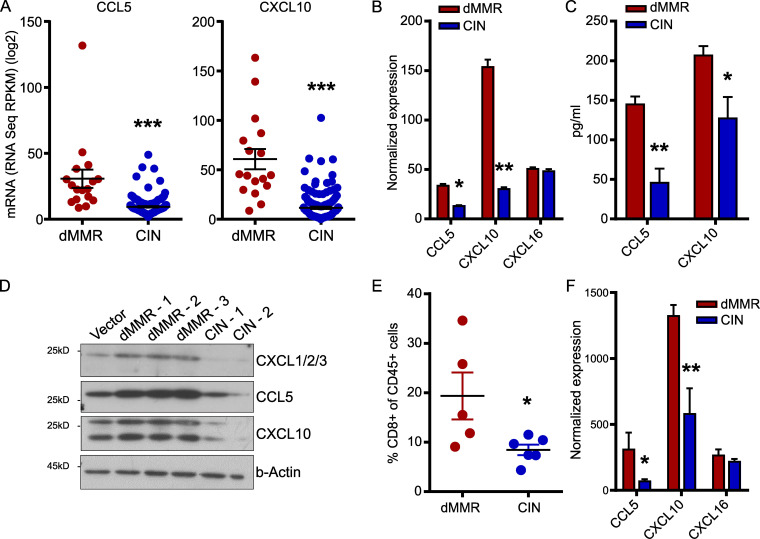
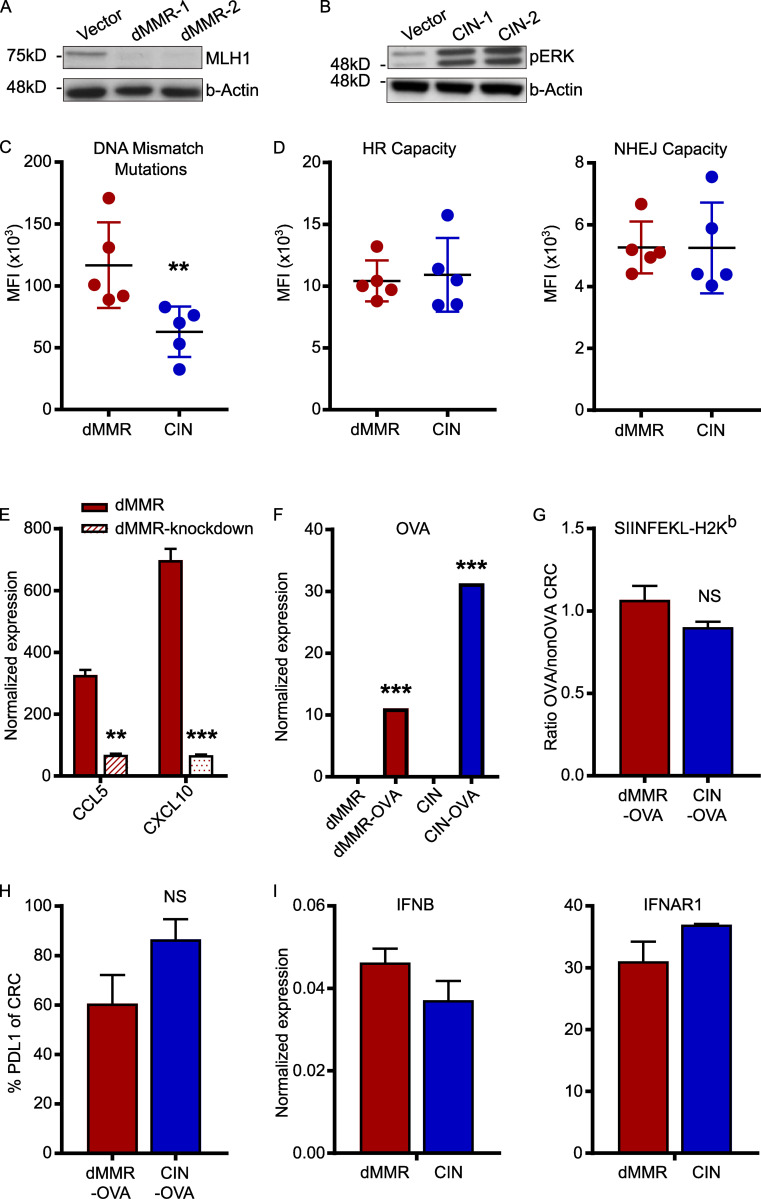
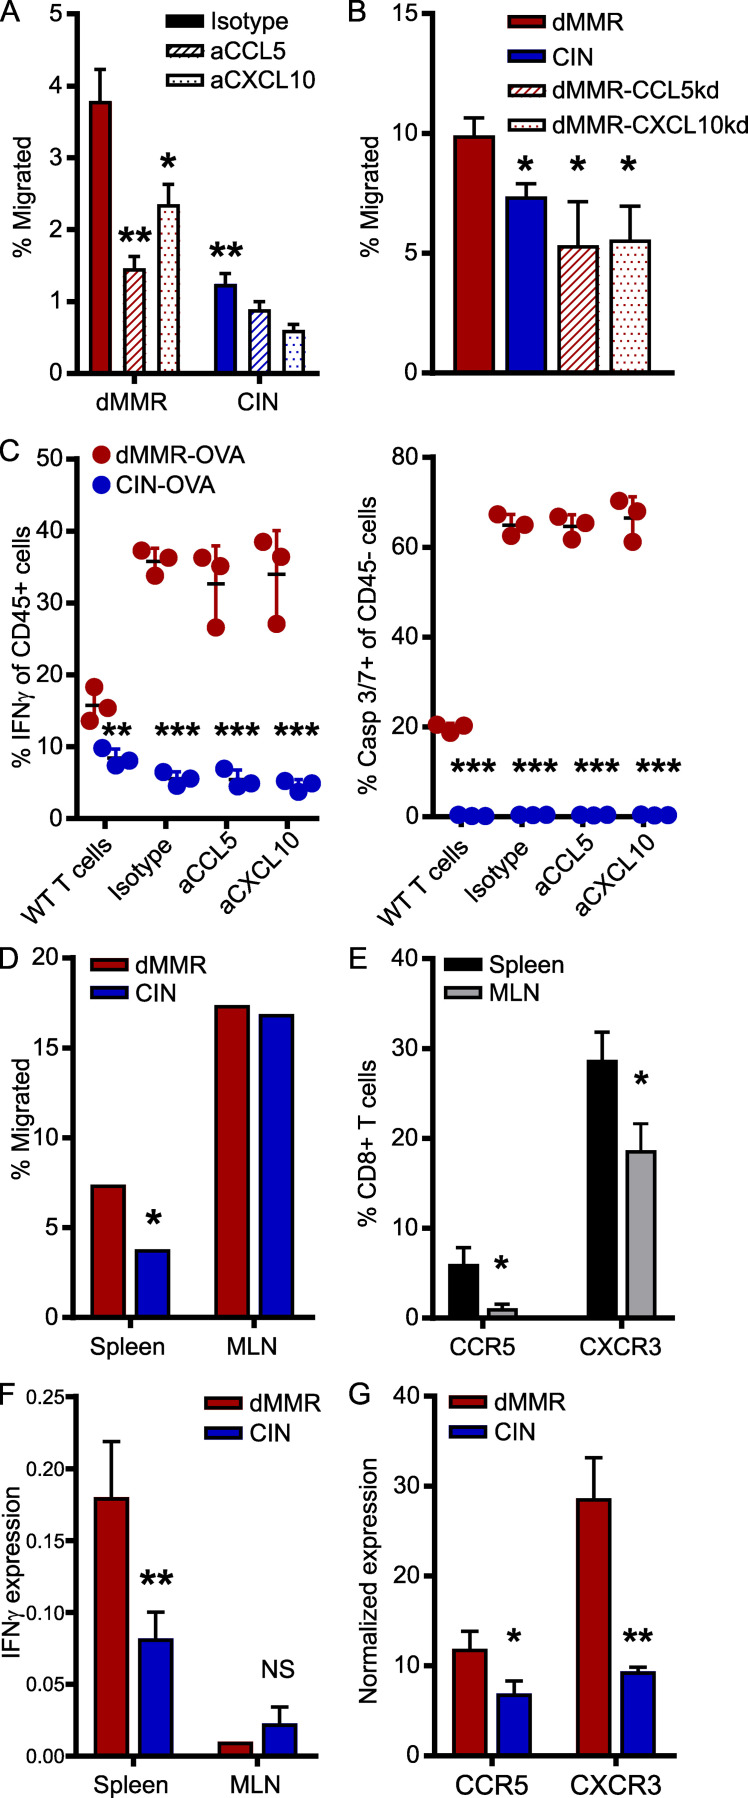
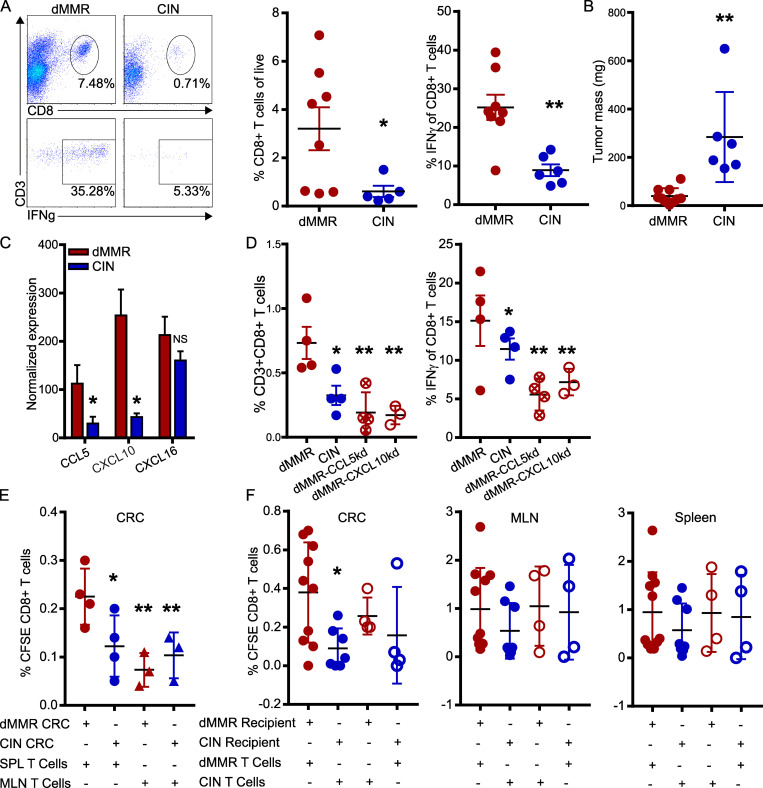
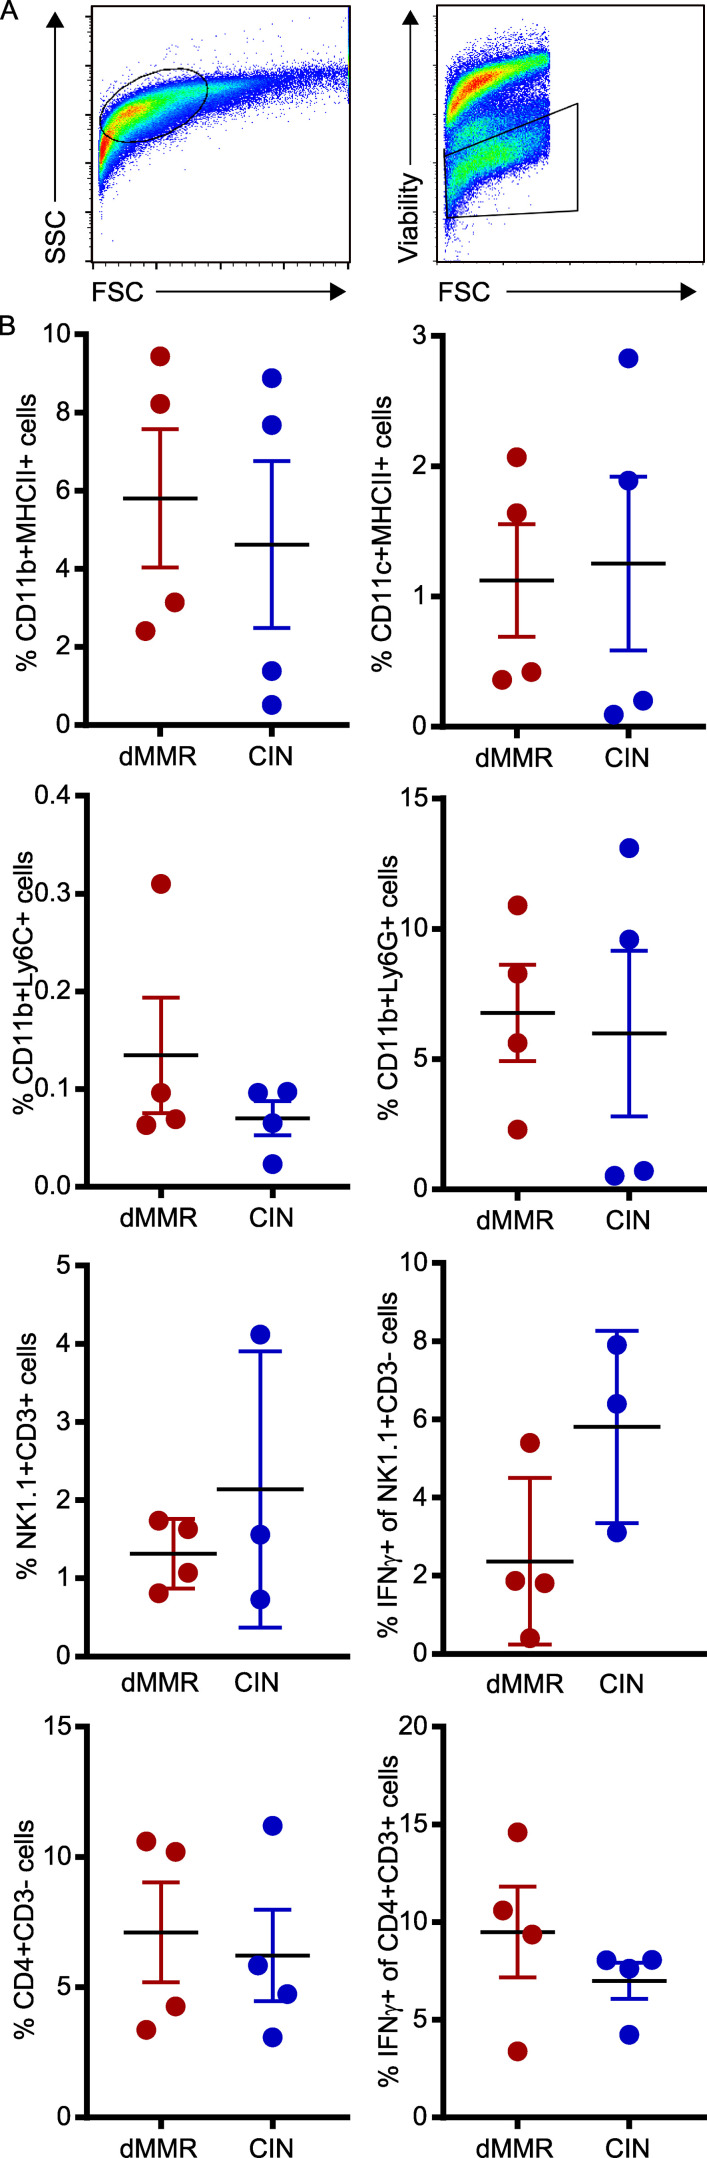
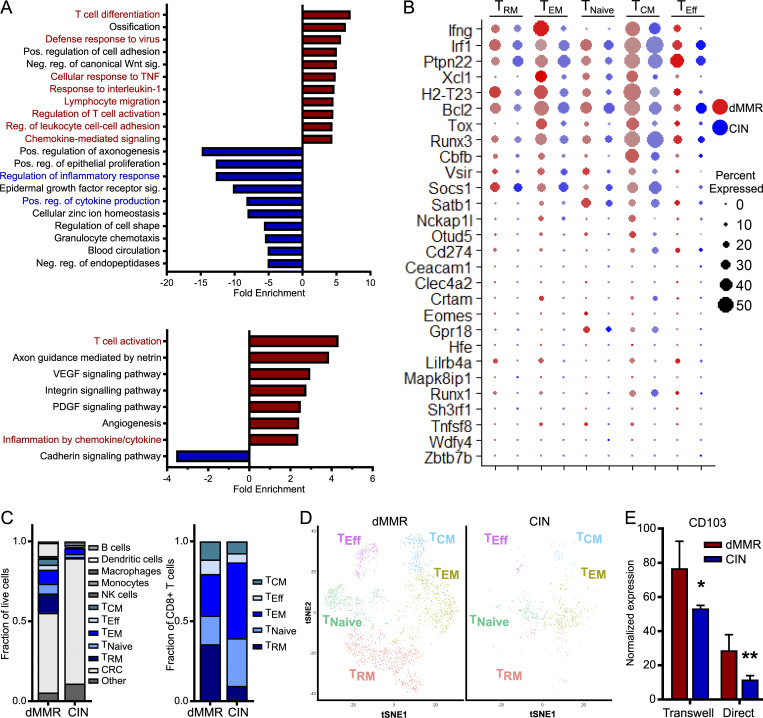
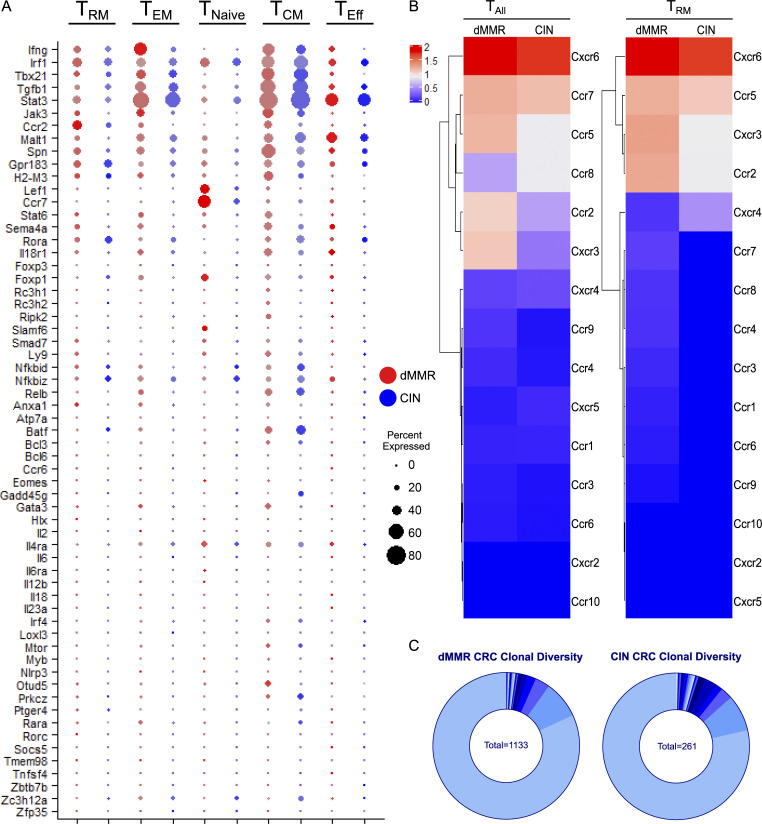
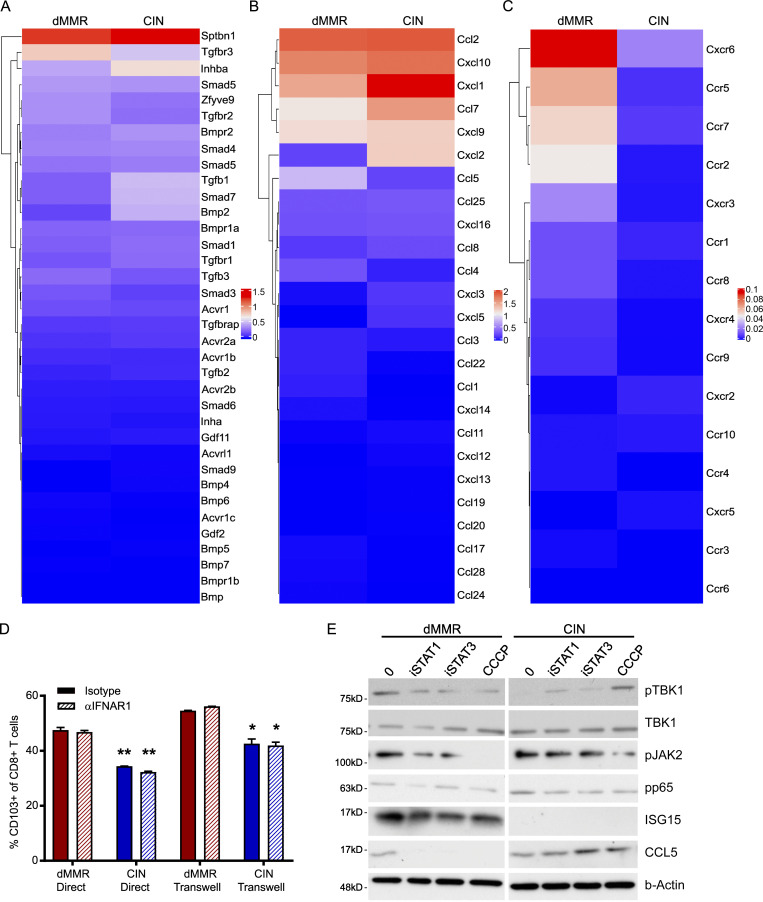
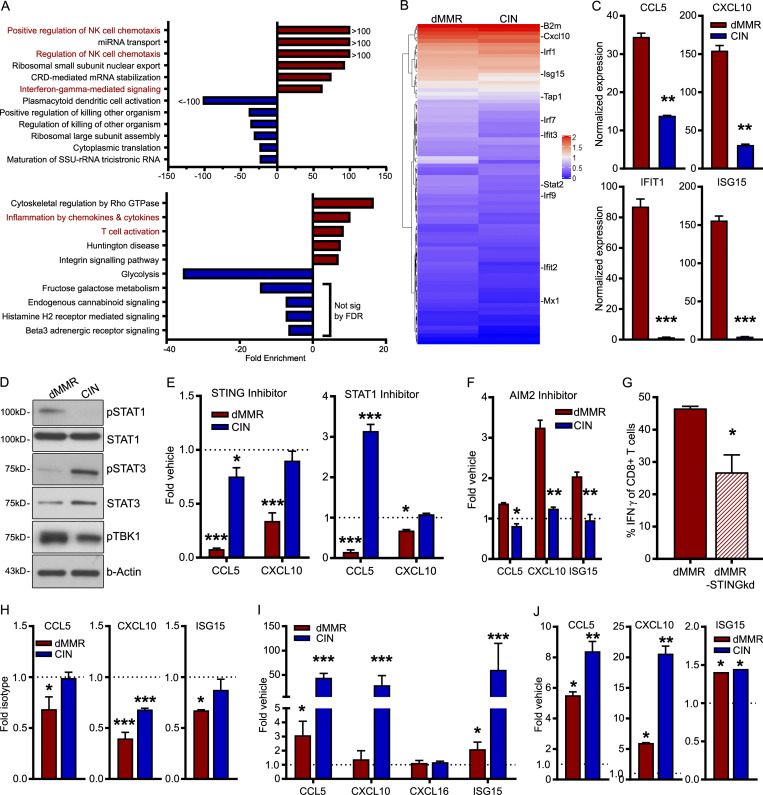
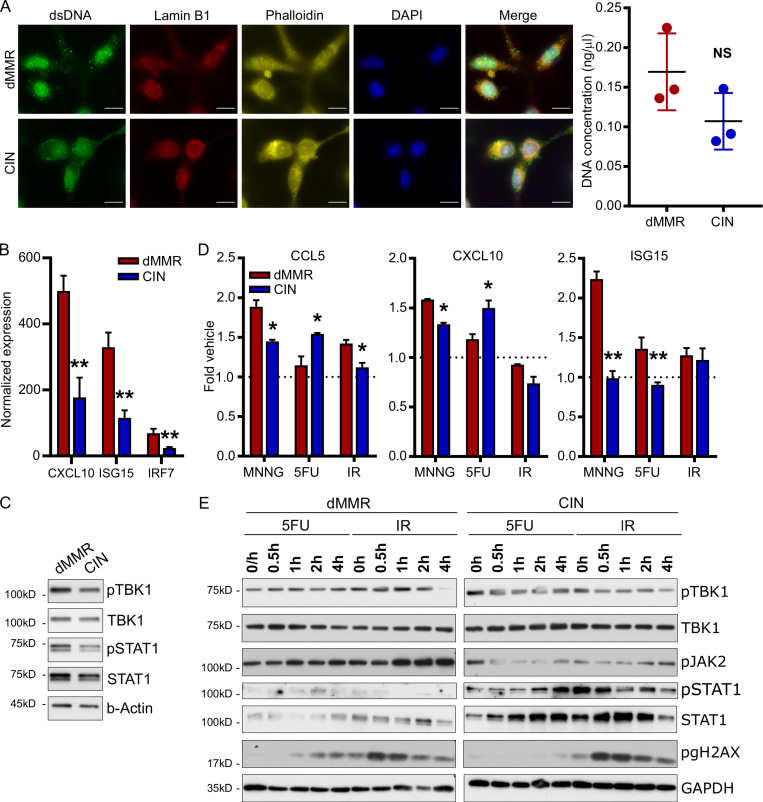
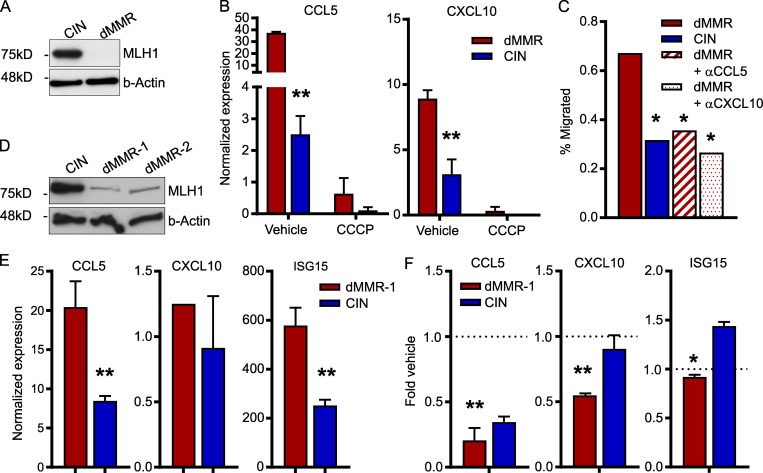
Colorectal cancers (CRCs) deficient in DNA mismatch repair (dMMR) contain abundant CD8+ tumor-infiltrating lymphocytes (TILs) responding to the abundant neoantigens from their unstable genomes. Priming of such tumor-targeted TILs first requires recruitment of CD8+ T cells into the tumors, implying that this is an essential prerequisite of successful dMMR anti-tumor immunity. We have discovered that selective recruitment and activation of systemic CD8+ T cells into dMMR CRCs strictly depend on overexpression of CCL5 and CXCL10 due to endogenous activation of cGAS/STING and type I IFN signaling by damaged DNA. TIL infiltration into orthotopic dMMR CRCs is neoantigen-independent and followed by induction of a resident memory-like phenotype key to the anti-tumor response. CCL5 and CXCL10 could be up-regulated by common chemotherapies in all CRCs, indicating that facilitating CD8+ T cell recruitment underlies their efficacy. Induction of CCL5 and CXCL10 thus represents a tractable therapeutic strategy to induce TIL recruitment into CRCs, where local priming can be maximized even in neoantigen-poor CRCs.


Conflict of interest statement

Disclosures: K. Baker reported grants from Canadian Institutes of Health Research and from Canadian Foundation for Innovation during the conduct of the study. No other disclosures were reported.

Figures

Figure 1.
Figure 1.
Mismatch repair deficiency in CRC induces a chemokine signature associated with CD8+ T cell recruitment.(A) Chemokine expression in dMMR CRCs and CIN CRCs from the TCGA PanCancer Atlas. (B) dMMR and CIN models of the MC38 mouse CRC cell line were created by mutating Mlh1 and Kras, respectively. Chemokine expression in the cell lines was assessed by qPCR. n = 3 repeats. (C and D) Chemokine secretion was analyzed by cytokine bead array of the cell supernatants (C) or Western blotting (D) of lysates from three different clones of dMMR MC38 cells and two different clones of CIN MC38 CRC cells. Clones 1 were used in all subsequent experiments. n = 3 repeats each. (E) Infiltration of CD8+CD3+ T cells into subcutaneously injected dMMR and CIN MC38 CRC tumors was assessed by flow cytometry. n ≥ 4 mice per group, four repeats. (F) Chemokine expression was assessed by qPCR on whole tissue transcripts isolated from subcutaneous dMMR and CIN CRCs. n ≥ 4 mice per group, four repeats. dMMR versus CIN: *, P ≤ 0.05; **, P ≤ 0.01; *** P, ≤ 0.005. RPKM, reads per kilobase million.
Figure S1.
Figure S1.
Confirmation of successful generation of dMMR and CIN MC38 CRC cell line variants. dMMR and CIN models of the MC38 mouse CRC cell line were created by mutating Mlh1 and Kras, respectively. (A and B) Protein expression was analyzed by Western blotting lysates from two different clones of dMMR MC38 cells and two different clones of CIN MC38 CRC cells. Clones 1 were used in all subsequent experiments. n = 3 repeats. (C) Microsatellite instability was measured using a reporter plasmid where uncorrected deletion and insertion mutations in microsatellite regions of a promoter enable expression of β-galactosidase. Cells were transiently transfected with the reporter plasmid, and β-galactosidase expression was measured after 24 h by flow cytometry using a fluorescence-based readout. Increasing fluorescence corresponds to increased microsatellite instability due to the failure of DNA mismatch repair to correct insertions and deletions. (D) HR and NHEJ were measured using a fluorescent reporter assay. Cells were transiently transfected with the reporter plasmids and the amount of HR and NHEJ were quantified by flow cytometry after 24 h. Increasing fluorescence corresponds to increased DNA repair by each mechanism. (E) Depletion of CCL5 and CXCL10 in dMMR-CCL5kd and CXCL10kd cells following stable transduction with shRNA plasmids was verified by qPCR. (F) Expression of OVA was verified in stable clones of dMMR-OVA and CIN-OVA using qPCR. (G) Surface expression of MHC-I SIINFEKL-H-2Kb was verified in dMMR-OVA and CIN-OVA CRC cells using flow cytometry. (H) Surface expression of PDL1 on dMMR and CIN CRC was measured with flow cytometry. (I) Expression of IFNB and IFNAR1 in untreated dMMR and CIN CRC cells using qPCR. All panels: representative data from n = 3–5 repeats. dMMR versus indicated bar. **, P ≤ 0.01; ***, P ≤ 0.001. MFI, mean fluorescence intensity.
Figure 2.
Figure 2.
CCL5 and CXCL10 expression is essential for the recruitment and activation of systemic CD8+ T cells by dMMR CRCs.(A) CD8+ T cell migration through a Matrigel-coated 5.0-µm Transwell insert toward supernatant conditioned for 24 h by dMMR or CIN MC38 CRCs. Anti-CCL5, CXCL10, or isotype control antibodies were added at 2.0 µg/ml 30 min before T cells were added. Migrated cells were quantified after 2 h by flow cytometry. n = 5 repeats. (B) CD8+ T cell migration toward supernatant conditioned by dMMR, CIN, or dMMR cells deficient in either CCL5 or CXCL10. n = 3 repeats. (C) OTI CD8+ T cells were cultured with OVA-transfected variants of dMMR and CIN CRC cells at a 5:1 ratio for 48 h. T cell activation was measured by intracellular IFN-γ staining, and cytotoxicity was measured by caspase (Casp) 3/7 cleavage. Anti-CCL5, CXCL10, or isotype control was added at 2.0 µg/ml 30 min before T cells were added. WT CD8+ T cells isolated from C57BL/6 mice were used as controls. Representative data from n = 3 repeats. (D) Migration of CD8+ T cells isolated from the spleen or MLNs toward supernatant conditioned by dMMR or CIN CRCs. Representative data from n = 4 repeats. (E) Baseline chemokine receptor expression on CD8+ T cells isolated from the spleen or MLN was assessed by flow cytometry directly after isolation. n ≥ 3 mice per group, four repeats. Spleen versus MLN: *, P ≤ 0.05. (F) Activation of CD8+ T cells isolated from the spleen or MLN and co-cultured at a 5:1 ratio with dMMR or CIN CRC cells for 24 h. CD8+ cells were isolated, and IFN-γ expression was quantified by qPCR. n = 3 repeats. (G) Expression of CCR5 and CXCR3 on CD8+ T cells co-cultured with dMMR or CIN CRC cells for 24 h. CD8+ cells were isolated, and IFN-γ expression was quantified by qPCR. n = 3 repeats. (A–E and G) dMMR versus indicated bar. *, P ≤ 0.05; **, P ≤ 0.01; ***, P ≤ 0.001.
Figure 3.
Figure 3.
Orthotopically implanted dMMR CRCs use CCL5 and CXCL10 to efficiently recruit systemic CD8+ TILs.(A) CD8+ T cell infiltration and activation in orthotopic tumors 14–21 d after injecting 1.5 × 10⁵ CRC cells in 50 µl PBS into the colon wall of WT mice using an endoscope. n ≥ 4 mice per group, five repeats. (B) Mass of orthotopic dMMR and CIN CRCs. (C) Chemokine expression in whole-tissue transcripts of orthotopic dMMR and CIN CRCs was analyzed by qPCR. (D) Infiltration and activation of CD8+ T cells in orthotopic dMMR, CIN, or dMMR cells deficient in either CCL5 or CXCL10. n = 4 mice per group, four repeats. (E and F) Mice with orthotopic CRCs were adoptively transferred i.v. with 2 × 10⁶ CFSE-stained CD8+ T cells from the MLN (E) or spleens (SPL; E and F) of tumor-bearing donors. 48 h later, T cell infiltration was assessed by flow cytometry in the CRC (E and F), MLN, and spleens (F) of recipients. Pooled data from n = 3 repeats. All panels, dMMR versus indicated bar. *, P ≤ 0.05; **, P ≤ 0.01.
Figure S2.
Figure S2.
Immune cell subset frequencies in orthotopically implanted dMMR and CIN CRC tumors. 1.5 × 10⁵ CRC cells in 50 µl were nonsurgically injected into the colonic wall using an endoscope. n ≥ 4 mice per group, five repeats. (A) Initial gating strategy. (B) Immune cell subsets infiltrating the tumors were quantified by flow cytometry using the indicated markers. FSC, forward scatter; SSC, side scatter.
Figure 4.
Figure 4.
Orthotopic dMMR CRCs up-regulate TRM markers on infiltrating systemic CD8+ T cells. scRNAseq was performed on orthotopically grown dMMR and CIN CRCs. Five mice were pooled from each CRC type. (A) GO enrichment analysis of the most enriched biological processes (top) and signaling pathways (bottom) for CD8+ T cells in orthotopic dMMR compared with CIN CRCs. (B) Expression of genes in the “CD8 T Cell Activation” GO term list. Size of the dot represents percent of cells and color intensity represents expression level. (C) Proportion of cell types identified by scRNAseq within the tumor microenvironment of orthotopic dMMR and CIN CRC (left) and within the CD8+ T cell subsets (right). TNaive, naive T cells; TEM, effector memory T cells; TEff, effector T cells; TCM, central memory T cells. (D) tSNE plots of CD8+ T cell subsets identified by scRNAseq in orthotopic dMMR and CIN CRCs. (E) Induction of CD103 in CD8+ T cells by dMMR and CIN CRCs was measured by qPCR after coculturing cells directly or separated by a 0.4-µm Transwell filter for 24 h. Representative data from n = 3 repeats. dMMR versus CIN: *, P ≤ 0.05; **, P ≤ 0.01. Neg., negative; Pos., positive; Reg., regulation; Sig., signaling.
Figure S3.
Figure S3.
dMMR CRCs contain more activated TILs than CIN CRCs but are equally clonally diverse.(A) Expression of genes in the “T Cell Activation” GO term list for different subsets of CD8+ TILs in orthotopic dMMR and CIN MC38 tumors analyzed by scRNAseq. Size of the dot represents percent of CD8+ T cells and color intensity represents expression level. TNaive, naive T cells; TEM, effector memory T cells; TEff, effector T cells; TCM, central memory T cells. (B) Expression of chemokine receptors on tumor infiltrating CD8+ T cells in orthotopic CRCs. TAll, All CD8+ T cells. (C) TCR frequency in the CD8+ TILs from orthotopic tumors analyzed by scRNAseq. Each section of the arc represents the number of cells with the indicated frequency. No significant difference exists between the frequency distribution of dMMR and CIN CRC TILs.
Figure S4.
Figure S4.
dMMR CRCs express more of select chemokines and chemokine receptors than CIN CRCs but similar levels of TGFβ-associated genes. (A–C) Expression of genes associated with the “TGFβ signaling” GO term gene (A), chemokines (B), and chemokine receptors (C) in orthotopic CRC cells. (D) Induction of CD103 on CD8+ T cells by dMMR and CIN CRCs was measured by flow cytometry after coculturing cells directly or separated by a 0.4-µm Transwell filter for 24 h. CRC cells were pretreated for 24 h by 10 µg/ml anti-IFNAR1 or isotype control. Representative data from n = 3 repeats. dMMR versus CIN of same treatment condition: *, P ≤ 0.05; **, P ≤ 0.01. (E) Dependence of chemokine endogenous signaling on cGAS/STING, STAT1, or STAT3 was assessed by treatment of CRC cells for 1 h with 10 µM CCCP, 10 µM fludarabine (iSTAT1), or 50 µM S3I-201 (iSTAT3), respectively. n = 3 repeats.
Figure 5.
Figure 5.
CCL5 and CXCL10 production results from active endogenous type I IFN signaling in dMMR CRCs but can be exogenously induced in CIN CRCs.(A) GO enrichment analysis of the most enriched biological processes (top) and signaling pathways (bottom) in dMMR compared with CIN orthotopic CRC cells analyzed by scRNAseq. (B) Expression of genes associated with “IFNA Signaling” GO term gene list in orthotopically grown CRC cells. (C) Baseline expression of key ISGs was assessed by qPCR in unstimulated dMMR and CIN CRC MC38 cells grown in vitro. n = 4 repeats. dMMR versus CIN: **, P ≤ 0.01; ***, P ≤ 0.005. (D) Baseline activation of proteins in the IFN and cGAS/STING signaling pathways in dMMR and CIN CRC cells grown in vitro. n = 3 repeats. (E and F) Dependence of chemokine expression on cGAS/STING and STAT1 (E) or Aim2 (F) signaling was assessed by treatment of CRC cells for 24 h with 2 µM H-151, 10 µM fludarabine, or 9 µg/ml phosphorothioate oligo, respectively. n = 3 repeats. (G) Dependence of CD8+ T cell activation on STING signaling in dMMR CRC. OTI CD8+ T cells were co-cultured with SIINFEKL-pulsed dMMR STING knockdown (STINGkd) or control dMMR cells for 48 h, and IFN-γ expression was measured by flow cytometry. n = 3 repeats. dMMR versus STINGkd: *, P ≤ 0.05. (H) Dependence on endogenous type I IFN signaling was assessed following 24 h treatment with 10 µg/ml anti-IFNAR1-blocking antibody. n = 4 repeats. Isotype versus indicated bar. *, P ≤ 0.05; **, P ≤ 0.01. (I and J) Sensitivity to exogenous induction of type I IFN signaling was assessed by qPCR following treatment of cells with 9 µg/ml cGAMP (I) or 1,000 U/ml IFNB (J) for 24 h. n = 3 repeats. (E and H–J) Vehicle versus treatment: *, P ≤ 0.05; **, P ≤ 0.01; ***, P ≤ 0.005. FDR, false discovery rate; NK, natural killer; sig, signaling.
Figure 6.
Figure 6.
Loss of DNA mismatch repair alters the stimulatory capacity of cytoplasmic DNA generated by baseline or treatment-induced genetic instability.(A) Cytoplasmic DNA was visualized by staining with an anti–double-stranded DNA antibody (left). Cytoplasmic DNA was isolated from untreated dMMR and CIN MC38 cells and quantified by Qubit (right). n = 4 repeats. Scale bar, 10 µm. (B) BMDCs were stimulated for 3 h with 500 ng of cytoplasmic DNA isolated from dMMR or CIN CRC cells. Gene expression was evaluated by qPCR. n = 3 repeats. (C) BMDCs were treated as in B for 20 min and analyzed for signaling activation. n = 3 repeats. (D) Expression of IFN-associated genes in dMMR and CIN MC38 CRC cells treated with genotoxic agents (10 µM MNNG, 1 µM 5FU, 10 Gy IR) for 24 h. Expression was assessed by qPCR. n = 4 repeats. (E) Activation of STING signaling in cells treated as in D. n = 3 repeats. For all panels, dMMR versus CIN: *, P ≤ 0.05; **, P ≤ 0.01.
Figure 7.
Figure 7.
Loss of DNA mismatch repair in primary mouse and CRC patient organoids up-regulates chemokine production and type I IFN signaling.(A) Baseline protein expression from primary mouse CRC organoids. CRC was induced by 10 weekly injections of 10 µg/kg azoxymethane followed by another 10 wk without treatment. Mlh1 was stably knocked down by lentiviral transduction with shRNA and hygromycin selection to establish dMMR organoids. Scrambled shRNA-transduced organoids were used as CIN controls. n = 4 repeats. (B) Reduced expression of ISGs following 24 h incubation of the dMMR and CIN organoids with 10 µM of the cGAS/STING inhibitor CCCP. n = 3 repeats. dMMR versus CIN: **, P ≤ 0.01. (C) CD8+ T cell migration toward supernatant conditioned for 24 h by established dMMR or CIN organoids. dMMR versus indicated bar. *, P ≤ 0.05. (D and E) Baseline protein (D) and RNA (E) expression in organoids established from CRC patients. dMMR organoids were generated by stably knocking down MLH1 as in A with the appropriate shRNA and Scramble CIN control. dMMR versus CIN: **, P ≤ 0.01. (F) Inhibition of chemokine and ISG expression by treatment of human CRC organoids for 24 h with 10 µM CCCP. n = 2 patients, three repeats each. Vehicle versus *, P ≤ 0.05; **, P ≤ 0.01.

Similar articles

Cited by

References

    1. Baghirova, S., Hughes B.G., Hendzel M.J., and Schulz R.. 2015. Sequential fractionation and isolation of subcellular proteins from tissue or cultured cells. MethodsX. 2:440–445. 10.1016/j.mex.2015.11.001 - DOI - PMC - PubMed
    1. Baker, K., Zlobec I., Tornillo L., Terracciano L., Jass J.R., and Lugli A.. 2007. Differential significance of tumour infiltrating lymphocytes in sporadic mismatch repair deficient versus proficient colorectal cancers: a potential role for dysregulation of the transforming growth factor-beta pathway. Eur. J. Cancer. 43:624–631. 10.1016/j.ejca.2006.11.012 - DOI - PubMed
    1. Baker, K., Qiao S.W., Kuo T.T., Aveson V.G., Platzer B., Andersen J.T., Sandlie I., Chen Z., de Haar C., Lencer W.I., et al. . 2011. Neonatal Fc receptor for IgG (FcRn) regulates cross-presentation of IgG immune complexes by CD8-CD11b+ dendritic cells. Proc. Natl. Acad. Sci. USA. 108:9927–9932. 10.1073/pnas.1019037108 - DOI - PMC - PubMed
    1. Baker, K., Rath T., Flak M.B., Arthur J.C., Chen Z., Glickman J.N., Zlobec I., Karamitopoulou E., Stachler M.D., Odze R.D., et al. . 2013. Neonatal Fc receptor expression in dendritic cells mediates protective immunity against colorectal cancer. Immunity. 39:1095–1107. 10.1016/j.immuni.2013.11.003 - DOI - PMC - PubMed
    1. Bindea, G., Mlecnik B., Tosolini M., Kirilovsky A., Waldner M., Obenauf A.C., Angell H., Fredriksen T., Lafontaine L., Berger A., et al. . 2013. Spatiotemporal dynamics of intratumoral immune cells reveal the immune landscape in human cancer. Immunity. 39:782–795. 10.1016/j.immuni.2013.10.003 - DOI - PubMed

Publication types

MeSH terms

Grants and funding