. 2021 Jan 22;2(1):tgab004.
doi: 10.1093/texcom/tgab004. eCollection 2021.

Electrographic Features of Spontaneous Recurrent Seizures in a Mouse Model of Extended Hippocampal Kindling

Affiliations

Electrographic Features of Spontaneous Recurrent Seizures in a Mouse Model of Extended Hippocampal Kindling

Haiyu Liu et al. Cereb Cortex Commun. .

Abstract

Epilepsy is a chronic neurological disorder characterized by spontaneous recurrent seizures (SRS) and comorbidities. Kindling through repetitive brief stimulation of a limbic structure is a commonly used model of temporal lobe epilepsy. Particularly, extended kindling over a period up to a few months can induce SRS, which may simulate slowly evolving epileptogenesis of temporal lobe epilepsy. Currently, electroencephalographic (EEG) features of SRS in rodent models of extended kindling remain to be detailed. We explored this using a mouse model of extended hippocampal kindling. Intracranial EEG recordings were made from the kindled hippocampus and unstimulated hippocampal, neocortical, piriform, entorhinal, or thalamic area in individual mice. Spontaneous EEG discharges with concurrent low-voltage fast onsets were observed from the two corresponding areas in nearly all SRS detected, irrespective of associated motor seizures. Examined in brain slices, epileptiform discharges were induced by alkaline artificial cerebrospinal fluid in the hippocampal CA3, piriform and entorhinal cortical areas of extended kindled mice but not control mice. Together, these in vivo and in vitro observations suggest that the epileptic activity involving a macroscopic network may generate concurrent discharges in forebrain areas and initiate SRS in hippocampally kindled mice.

Keywords: brain slices; convulsion; epilepsy; ictal discharges; intracranial electroencephalograph.


Figures

Figure 1
Figure 1
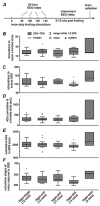
Kindling seizure progression. (A) An outline of experimental design. A total of 24-h EEG-video monitoring made after 80, 100, 120, and/or 140 stimuli. No stimulation applied if ≥2 SRS observed in the 24-h monitoring. Further EEG-video monitoring made intermittently for up to 3 months after termination of kindling. Brain tissues collected afterward for brain slice recordings or histological assessments. (BF) Data from mice in the 5 implantation groups. (B and C) Numbers of stimuli needed to reach a kindled state and to induced SRS. (D and E) Cumulative durations of evoked ADs to the kindled state or SRS. (F) Cumulative stages of evoked motor seizures to SRS. These measures did not differ significantly among the hippo-hippo, hippo-cortex, hippo-piriform, and hippo-thalamus groups (P > 0.05, 1-way ANOVA following a Bonferroni post hoc test). Measures from the hippo-entorhinal group not included for group comparison due to a low sample size.
Figure 2
Figure 2
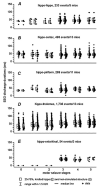
Relations of EEG discharge durations and motor seizure stages. Discharges and associated motor seizures were assessed for individual SRS events. (A–E) Measures from mice in the 5 implantation groups were presented. Numbers of SRS events and mice examined in each group were indicated. There was no significant difference between durations of stimulated and unstimulated sites at each stage of motor seizures (Student’s t test or Mann–Whitney U test). Regional discharge durations corresponding to stage 1–5 motor seizures were not significantly different in each group (nonparametric ANOVA on rank test). There was no strong correlation between regional discharge durations and motor seizure stages (linear regression analysis, R2 = 0.001–0.022).
Figure 3
Figure 3
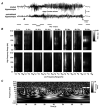
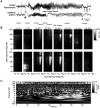
Bilateral hippocampal activities and corresponding PAC, WPC analyses. (A) Original EEG signals collected in a frequency band of 0.1–1000 Hz were illustrated. Putative discharge onset or termination denoted by a filled and open arrow. Discharges were associated with a stage 3 motor seizure. (B) PAC of kindled (top) and unstimulated (bottom) hippocampal activities. Eight sequential windows with indicated times matched horizontal bars below traces in (A). The low-frequency range used for the phase information was 1–30 Hz and the high-frequency range used for the amplitude information was 32–512 Hz, with increments on a logarithmic scale. Note that PAC in window 4 between 20–25 Hz (x) and 128–512 Hz (y) signals and in window 6 between 2–3 and 64–512 Hz signals were stronger in the top than in bottom panels. (C) WPC plot for the corresponding regional signals in (A). WPC was applied to each wavelet central frequency from 0.25 to 512 Hz with increments on a logarithmic scale and window size proportional to 8 cycles of each frequency. Scale 1 indicated a phase lock. Note phase-locked/near phase-lock discharge signals appearing around the 20–32 s time stamps and in a frequency range of 20–80 Hz as well as around the 30–40 and 56–70 s time stamps and in a frequency range of 1–16 Hz. Also, note these coherent signals were accompanied with dissimilar regional PAC in windows 3–7.
Figure 4
Figure 4
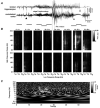
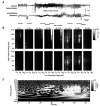
Hippocampal–cortical discharges, corresponding PAC, and WPC analyses. (A) Original EEG signals similarly illustrated as in Figure 3. Discharges were associated with a stage 5 motor seizure (Supplementary Video 1). Note large artifacts in middle discharges and different termination times of regional discharges. (B and C) PAC and WPC plots similarly arranged as in Figure 3. Note in (B) and in windows 6–7 there were stronger PAC between 2–3 and 32–256 Hz signals in the top (hippocampal) than bottom (cortical) panels. Note in (C) phase-locked or near phase-locked signals appearing around in the 18–28 s time stamps and in frequency ranges of 10–20 as well as 30–80 Hz.
Figure 5
Figure 5
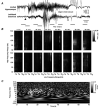
Hippocampal–piriform discharges, corresponding PAC, and WPC analyses. (A) Original EEG signals similarly illustrated as in Figure 3. Discharges were associated with a stage 4 motor seizure (Supplementary Video 2). (B and C) PAC and WPC plots similarly arranged as in Figure 3. Note in (B) and in windows 3–5 there were stronger PAC between roughly 12–20 and 64–256 Hz signals in the bottom (piriform) than in top (hippocampus) panels. Note in (C) phase-lock or near phase-locked discharge signals appearing around in the 15–30 s time stamps and in at frequencies around 16 Hz as well as in the 35–60 s time stamps and in a lower (1–5 Hz) and a higher (15–25 Hz) frequency range. These coherent signals were accompanied with dissimilar regional PAC in windows 3–6.
Figure 6
Figure 6
Hippocampal–thalamic discharges, corresponding PAC, and WPC plots. (A) Original EEG signals similarly illustrated as in Figure 3. Discharges were associated with a stage 3 motor seizure (Supplementary video 3). (B and C) PAC and WPC plots similarly arranged as in Figure 3. Note in (B) and in windows 4–5 there were stronger PAC between 20–25 and 128–512 Hz signals in top (hippocampus) than low (thalamus) panels. Note in (C) phase-locked or near phase-locked discharge signals appearing around in the 18–32 s time stamps and in a frequency range of 16–80 Hz as well as in the 36–56 s time stamps and in a frequency range of 4–80 Hz. The later coherent signals were accompanied with seemingly similar regional PAC in windows 6–7.
Figure 7
Figure 7
Hippocampal–entorhinal discharges, corresponding PAC, and WPC plots. (A) Original EEG signals similarly illustrated as in Figure 3. Discharges were associated with a stage 3 motor seizure. Note large artifacts in middle discharges and large amplitude spikes following hippocampal discharge. (B and C) PAC and WPC plots similarly arranged as in Figure 3. Note in (B) and in windows 3–6 there were weak but different regional (hippocampal vs. entorhinal) PAC. Note in (C) phase-locked or near phase-locked discharge signals appearing around in the 11–24 s time stamps and in a frequency range of roughly 10–32 Hz.
Figure 8
Figure 8
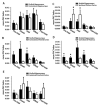
Summaries of regional PAC. (A–E) corresponding regional discharges from mice in the 5 implantation groups were analyzed (1–2 discharge events per mouse and 3–5 mice per implantation group). Mean PAC indexes were computed using both spectral and temporal averaging. Discharges were abbreviated as ictal in x-axis. Peri-ictal segments were chosen to be at least 8 s long to include at least 2 PAC windows. Onset sections were the first 8 s of the electrographic discharge onset. Ictal sections included entire discharges excluding onset and offset segments. Offset sections were the last 8 s of the electrographic discharges. Postictal sections were 8 s following electrographic discharge termination. PAC windows containing large movement artifacts were excluded from the analysis. *, Kindled hippocampus versus corresponding unstimulated structure, P < 0.05, Mann–Whitney U test. Note in (B and D) significantly stronger PAC in the kindled hippocampus than in corresponding unstimulated cortex or thalamus. Also note in (C) significantly weaker PAC in the kindled hippocampus relative to corresponding unstimulated piriform cortex.
Figure 9
Figure 9
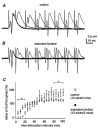
Effects of paired stimulations on DG population spikes. (A and B) Representative traces collected from slices of a control mouse (A) and a kindled mouse (B). Population spikes were evoked by paired stimuli with interstimulus intervals of 10–80 ms. Traces were superimposed for illustration purpose. Note that in response to paired stimuli with an interval of 10 ms, the second stimulus evoked a small spike in (B) (kindled) but not in (A) (control). (C) Data collected from 12 slices of 4 control mice and from 13 slices of 5 kindled mice. y-axis, the amplitude ratios (%, mean ± SE) of the second versus the second spikes. x-axis, interstimulus intervals. *Kindled versus control, Student’s t-test, P < 0.05. Note that spike inhibition or enhancement by paired stimuli at intervals of 5–20 or 80–100 ms were attenuated in slices of kindled mice.
Figure 10
Figure 10
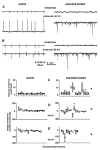
CA3 in vitro SPWs and related synaptic currents. (A and B) 2 CA3 pyramidal neurons voltage clamped at −40 (A) and − 60 mV (B) together with local extracellular recordings. Note smaller SPW-related outward (upward) components at −40 mV and larger inward (downward) components at −60 mV in kindled than in control neuron. (CE) Data collected from 18 neurons of 4 control mice and from 17 neurons of 5 kindled mice. *, Kindled versus controls, median values comparisons, P ≤ 0.05, Student’s t-test, or Mann–Whitney U test. Note in (C) less frequent (with longer intervals) CA3 SPWs in slices of kindled mice. Also, note in (D) that synaptic conductance measured at −40 mV were outward dominant in control neurons but mixed inward–outward in kindled neurons. In (E), synaptic conductance measures at −60 mV were mixed inward and outward components in control neurons but robust inward components in kindled neurons.
Figure 11
Figure 11
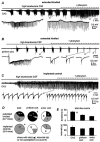
Epileptiform field potentials induced by high-bicarbonate ACSF. (AC) Extracellular traces collected from slices of 2 kindled mice and a control mouse. Top, continuous traces illustrated after treatment with a band-pass filter (2–500 Hz). The application times of phenytoin (100 μM) indicated above traces. Arrowed events illustrated in a wide frequency range (0–1000 Hz). Note in (A and B) phenytoin suppressed ictal discharges but not interictal spikes. Also note in (C) interictal spikes persisted following phenytoin application. (D) Proportions of slices with or without induced epileptiform field potentials. *, Kindled versus control; $, piriform versus CA3 or entorhinal area; #, CA3 versus piriform or entorhinal area; Chi-square or Fisher’s exact test, P < 0.05. (E) Discharges measured from the CA3, piriform, and entorhinal areas (5–14 events/area). #CA3 versus piriform or entorhinal area, 1-way ANOVA, P < 0.05.
Figure 12
Figure 12
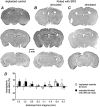
General histological observations from control and extended kindled mice. (AC) Images taken from a control mouse (A) and 2 extended kindled mice with SRS (B and C). Cryostat coronal sections (50 μm) were stained with cresyl violet and images were obtained by a slide scanner at ×20 magnification. Kindled hemispheres in (B and C) indicated. (D) Ratios (%) of bilateral hemispheric areas. Hemispheric areas were measured at 8 coronal levels as indicated in x-axis. Data were obtained from 6 control and 6 kindled mice. There was no significant group difference at each coronal level tested (Student’s t-test or Mann–Whitney U test, P > 0.05).

Similar articles

Cited by

References

    1. Amaral DG, Witter MP. 1998. The three-dimensional organization of the hippocampal formation: a review of anatomical data. Neuroscience. 31:571–591. - PubMed
    1. Aronica E, Mühlebner A, Vliet EA, Gorter JA. 2017. In: Pitkänen A, Buckmaster PS, Galanopoulou AS, Moshé LS, editors. Models of seizures and epilepsy. 2nd ed. United Kingdom: Academic Press. pp. 139–160.
    1. Avoli M, Curtis M, Gnatkovsky V, Gotman J, Köhling R, Lévesque M, Manseau F, Shiri Z, Williams S. 2016. Specific imbalance of excitatory/inhibitory signaling establishes seizure onset pattern in temporal lobe epilepsy. J Neurophysiol. 115(6):3229–3237. - PMC - PubMed
    1. Bandarabadi M, Gast H, Rummel C, Bassetti C, Adamantidis A, Schindler K, Zubler F. 2019. Assessing epileptogenicity using phase-locked high frequency oscillations: a systematic comparison of methods. Front Neurol. 10:1132. - PMC - PubMed
    1. Bertram EH. 2014. Extratemporal lobe circuits in temporal lobe epilepsy. Epilepsy Behav. 38:13–18. - PubMed

LinkOut - more resources