Hexestrol Deteriorates Oocyte Quality via Perturbation of Mitochondrial Dynamics and Function
- PMID: 34295902
- PMCID: PMC8290218
- DOI: 10.3389/fcell.2021.708980
Hexestrol Deteriorates Oocyte Quality via Perturbation of Mitochondrial Dynamics and Function
Abstract
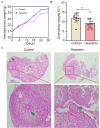
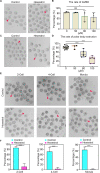
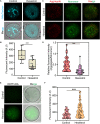
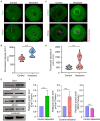
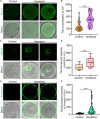
Hexestrol (HES) is a synthetic non-steroidal estrogen that was widely used illegally to boost the growth rate in livestock production and aquaculture. HES can also be transferred to humans from treated animals and the environment. HES has been shown to have an adverse effect on ovarian function and oogenesis, but the potential mechanism has not been clearly defined. To understand the potential mechanisms regarding how HES affect female ovarian function, we assessed oocyte quality by examining the critical events during oocyte maturation. We found that HES has an adverse effect on oocyte quality, indicated by the decreased capacity of oocyte maturation and early embryo development competency. Specifically, HES-exposed oocytes exhibited aberrant microtubule nucleation and spindle assembly, resulting in meiotic arrest. In addition, HES exposure disrupted mitochondrial distribution and the balance of mitochondrial fission and fusion, leading to aberrant mitochondrial membrane potential and accumulation of reactive oxygen species. Lastly, we found that HES exposure can increase cytosolic Ca2+ levels and induce DNA damage and early apoptosis. In summary, these results demonstrate that mitochondrial dysfunction and perturbation of normal mitochondrial fission and fusion dynamics could be major causes of reduced oocyte quality after HES exposure.
Keywords: apoptosis; hexestrol; mitochondria; oocyte maturation; ovary; spindle.
Copyright © 2021 Niu, Chen, Wang, Li, Liu, Ma and Duan.
Conflict of interest statement
The authors declare that the research was conducted in the absence of any commercial or financial relationships that could be construed as a potential conflict of interest.
Figures


Similar articles
-
Diethylstilbestrol exposure disrupts mouse oocyte meiotic maturation in vitro through affecting spindle assembly and chromosome alignment.Chemosphere. 2020 Jun;249:126182. doi: 10.1016/j.chemosphere.2020.126182. Epub 2020 Feb 11. Chemosphere. 2020. PMID: 32078850
-
Ethylene glycol butyl ether deteriorates oocyte quality via impairing mitochondrial function.FASEB J. 2021 Apr;35(4):e21280. doi: 10.1096/fj.202002157R. FASEB J. 2021. PMID: 33710673
-
Nonylphenol exposure affects mouse oocyte quality by inducing spindle defects and mitochondria dysfunction.Environ Pollut. 2020 Nov;266(Pt 1):114967. doi: 10.1016/j.envpol.2020.114967. Epub 2020 Jul 1. Environ Pollut. 2020. PMID: 32645552
-
Symposium review: Reduction in oocyte developmental competence by stress is associated with alterations in mitochondrial function.J Dairy Sci. 2018 Apr;101(4):3642-3654. doi: 10.3168/jds.2017-13389. Epub 2018 Feb 1. J Dairy Sci. 2018. PMID: 29395145 Review.
-
Age related changes in mitochondrial function and new approaches to study redox regulation in mammalian oocytes in response to age or maturation conditions.Mitochondrion. 2011 Sep;11(5):783-96. doi: 10.1016/j.mito.2010.08.011. Epub 2010 Sep 15. Mitochondrion. 2011. PMID: 20817047 Review.
Cited by
-
SIRT4 Expression Ameliorates the Detrimental Effect of Heat Stress via AMPK/mTOR Signaling Pathway in BMECs.Int J Mol Sci. 2022 Nov 1;23(21):13307. doi: 10.3390/ijms232113307. Int J Mol Sci. 2022. PMID: 36362094 Free PMC article.
-
Exposure to phenanthrene affects oocyte meiosis by inducing mitochondrial dysfunction and endoplasmic reticulum stress.Cell Prolif. 2023 Jan;56(1):e13335. doi: 10.1111/cpr.13335. Epub 2022 Sep 20. Cell Prolif. 2023. PMID: 36125441 Free PMC article.
-
miR-27a-3p relieves heat stress-induced mitochondrial damage and aberrant milk protein synthesis through MEK/ERK pathway in BMECs.Cell Stress Chaperones. 2023 May;28(3):265-274. doi: 10.1007/s12192-023-01334-z. Epub 2023 Mar 7. Cell Stress Chaperones. 2023. PMID: 36881375 Free PMC article.
-
Sirtuin 4 (Sirt4) downregulation contributes to chondrocyte senescence and osteoarthritis via mediating mitochondrial dysfunction.Int J Biol Sci. 2024 Jan 27;20(4):1256-1278. doi: 10.7150/ijbs.85585. eCollection 2024. Int J Biol Sci. 2024. PMID: 38385071 Free PMC article.
-
Depletion of serum-derived exosomes aggravates heat stress-induced damage of bovine mammary epithelial cells.Mol Biol Rep. 2022 Oct;49(10):9297-9305. doi: 10.1007/s11033-022-07767-6. Epub 2022 Aug 9. Mol Biol Rep. 2022. PMID: 35945402
References
LinkOut - more resources
Full Text Sources
Miscellaneous

