. 2021 Jul 6:9:643444.
doi: 10.3389/fcell.2021.643444. eCollection 2021.

A Conserved Role for Asrij/OCIAD1 in Progenitor Differentiation and Lineage Specification Through Functional Interaction With the Regulators of Mitochondrial Dynamics

Affiliations

A Conserved Role for Asrij/OCIAD1 in Progenitor Differentiation and Lineage Specification Through Functional Interaction With the Regulators of Mitochondrial Dynamics

Arindam Ray et al. Front Cell Dev Biol. .

Abstract

Mitochondria are highly dynamic organelles whose activity is an important determinant of blood stem and progenitor cell state. Mitochondrial morphology is maintained by continuous fission and fusion and affects stem cell proliferation, differentiation, and aging. However, the mechanism by which mitochondrial morphology and dynamics regulate cell differentiation and lineage choice remains incompletely understood. Asrij/OCIAD1 is a conserved protein that governs mitochondrial morphology, energy metabolism and human embryonic stem cell (hESC) differentiation. To investigate the in vivo relevance of these properties, we compared hESC phenotypes with those of Drosophila hematopoiesis, where Asrij is shown to regulate blood progenitor maintenance by conserved mechanisms. In concordance with hESC studies, we found that Drosophila Asrij also localizes to mitochondria of larval blood cells and its depletion from progenitors results in elongated mitochondria. Live imaging of asrij knockdown hemocytes and of OCIAD1 knockout hESCs showed reduced mitochondrial dynamics. Since key regulators of mitochondrial dynamics actively regulate mitochondrial morphology, we hypothesized that mitochondrial fission and fusion may control progenitor maintenance or differentiation in an Asrij-dependent manner. Knockdown of the fission regulator Drp1 in Drosophila lymph gland progenitors specifically suppressed crystal cell differentiation whereas depletion of the fusion regulator Marf (Drosophila Mitofusin) increased the same with concomitant upregulation of Notch signaling. These phenotypes were stronger in anterior progenitors and were exacerbated by Asrij depletion. Asrij is known to suppress Notch signaling and crystal cell differentiation. Our analysis reveals that synergistic interactions of Asrij with Drp1 and Marf have distinct impacts on lymph gland progenitor mitochondrial dynamics and crystal cell differentiation. Taken together, using invertebrate and mammalian model systems we demonstrate a conserved role for Asrij/OCIAD1 in linking mitochondrial dynamics and progenitor differentiation. Our study sets the stage for deciphering how regulators of mitochondrial dynamics may contribute to functional heterogeneity and lineage choice in vertebrate blood progenitors.

Keywords: Asrij; Drosophila lymph gland; Notch signaling; blood lineage choice; blood progenitor differentiation; human embryonic stem cells (hESC); mitochondrial dynamics; progenitor heterogeneity.


Conflict of interest statement

The authors declare that the research was conducted in the absence of any commercial or financial relationships that could be construed as a potential conflict of interest.

Figures
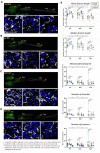
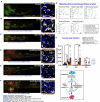
FIGURE 1
FIGURE 1
Asrij, Drp1, and Marf regulate mitochondrial morphology in blood progenitors of Drosophila lymph gland. (A–D) Mitochondria in lymph gland progenitors (pro-hemocytes) of the primary, secondary, and tertiary lobes are marked by dome > mito-GFP in control (domeGal4/ + ; UAS mito-GFP/ + ; + / +) (A), arj KD (domeGal4/ + ; UAS mito-GFP/ + ;UAS arj RNAi/ +) (B), Drp1 KD (domeGal4/ + ; UAS mito-GFP/ + ;UAS Drp1 RNAi/ +) (C), and Marf KD (domeGal4/ + ; UAS mito-GFP/ + ;UAS Marf RNAi/ +) (D) lymph glands. Arrowheads indicate the dome > mito-GFP positive progenitors across different lobes that are shown magnified in the lower panel (Pri.: Primary, Sec.: Secondary, and Tert.: Tertiary). Images represent single confocal section of 0.5 μm for easy visualization of mitochondria. (E) Violin plots show quantification of mitochondrial mean and median branch length, footprint, number of branches and number of junctions across primary, secondary, and tertiary lobes. Scale bar: 100 μm for upper LG panel and 5 μm for lower magnified view panel. Kruskal Wallis test was performed to determine statistical significance. P < 0.05, ∗∗P < 0.01, ∗∗∗P < 0.001, ns: non-significant.
FIGURE 2
FIGURE 2
Asrij/OCIAD1 depletion reduces mitochondrial network dynamics. (A) Time lapse live imaging of control (e33CGal > UAS mito-GFP) and asrij KD (e33CGal4 > UAS mito-GFP; UAS arj RNAi) circulatory hemocytes expressing mitochondria targeted GFP. Violin plots show quantification of variance in number of branches, number of junctions and mitochondrial footprint in control (n = 10 cells) and arj KD (n = 12 cells) hemocytes. (B) Similar quantifications are represented for Mitotracker stained WT (BJNhem20) (n = 30 cells) and OCIAD1-Het-KO (CRISPR-39) (n = 30 cells) live hESCs. Original data were used from Shetty et al. (2018) for analysis. Scale bar: 5 μm. Error bars represent SEM. Mann-Whitney two-tailed t-test was used to determine statistical significance. *P < 0.05, **P < 0.01, ***P < 0.001, ns: statistically non-significant difference.
FIGURE 3
FIGURE 3
Drp1 regulates blood cell homeostasis in Drosophila lymph gland. (A) Whole mount lymph gland showing expression of crystal cell marker ProPO in primary, secondary, and tertiary lobes of control (domeGal4 UAS 2xEGFP) and Drp1 KD (domeGal4 UAS 2xEGFP > UAS Drp1 RNAi) larvae. GFP marks the expression of prohemocyte marker Domeless. Bar diagram shows quantification of mean crystal cell fraction in primary, secondary, and tertiary lobes of indicated genotypes. (B) NRE-GFP (Notch responsive element-GFP) reports activation of Notch signaling in control (domeGal4/ + ; NRE-GFP/ + ; UAS mCD8 RFP/ +) and Drp1 KD (domeGal4/ + ; NRE-GFP/ + ; UAS mCD8 RFP/UAS Drp1 RNAi) lymph gland primary, secondary, and tertiary lobes. RFP marks the expression of prohemocyte marker Domeless. Bar diagram shows quantification of mean NRE-GFP positive (high) cell fraction in primary, secondary, and tertiary lobes of indicated genotypes. (C–E) Bar diagrams show quantification of mean dome > 2xEGFP positive prohemocyte fraction (C), P1 positive plasmatocyte fraction (D) and percentage of lymph glands with lamellocyte differentiation (E) in control and upon Drp1 KD. (F) Schematic summarizes effect of Drp1 on various hemocyte lineages and Notch signaling. n represents number of individual lymph gland lobes analyzed, and N represents number of larvae for each genotype. Scale bar: 100 μm. Error bars represent SEM. Multiple t-test was performed to determine statistical significance. ***P < 0.001, ns: statistically non-significant difference.
FIGURE 4
FIGURE 4
Marf regulates blood cell homeostasis and Notch signaling in Drosophila lymph gland. (A) Whole mount lymph gland showing expression of crystal cell marker ProPO in primary, secondary, and tertiary lobes of control (domeGal4 UAS 2xEGFP) and Marf KD (domeGal4 UAS 2xEGFP > UAS Marf RNAi) larvae. GFP marks the expression of prohemocyte marker Domeless. Bar diagram shows quantification of mean crystal cell fraction in primary, secondary, and tertiary lobes of indicated genotypes. (B) NRE-GFP reports activation of Notch signaling in control (domeGal4/ + ; NRE-GFP/ + ; UAS mCD8 RFP/ +) and Marf KD (domeGal4/ + ; NRE-GFP/ + ; UAS mCD8 RFP/UAS Marf RNAi) lymph gland primary, secondary, and tertiary lobes. RFP marks the expression of prohemocyte marker Domeless. Bar diagram shows quantification of mean NRE-GFP positive (high) cell fraction in primary, secondary, and tertiary lobes of indicated genotypes. (C–E) Bar diagrams show quantification of mean dome > 2xEGFP positive prohemocyte fraction (C), P1 positive plasmatocyte fraction (D) and percentage of lymph glands with lamellocyte differentiation (E) in control and upon Marf KD. (F) Schematic summarizes effect of Marf on various hemocyte lineages and Notch signaling. n represents number of individual lymph gland lobes analyzed, and N represents number of larvae for each genotype. Scale bar: 100 μm. Error bars represent SEM. Multiple t-test was performed to determine statistical significance. *P < 0.05, **P < 0.01, ***P < 0.001, ns: statistically non-significant difference.
FIGURE 5
FIGURE 5
Progenitor-specific genetic interaction of asrij with Drp1 and Marf controls crystal cell differentiation in the lymph gland. (A–F) Whole mount lymph gland showing ProPO expression (far red pseudo-colored to red) to mark crystal cells in primary (Pri.), secondary (Sec.), and tertiary (Tert.) lobes of control (A), arj KD (B), Drp1 OV (C), arj KD Drp1 OV (D), Marf KD (E), and arj KD Marf KD (F) larvae. The phenotypes of crystal cell differentiation are mentioned below each lymph gland image. The detailed genotypes are mentioned below the images panel for lymph gland. Scale bar: 100 μm. Mitochondrial morphology (dome > mito-GFP expression) in the primary lobe progenitors (marked by arrowhead) is shown adjacent to the lymph gland images of the respective genotypes in gray scale. The phenotype of mitochondria morphology is mentioned below each image. Single confocal slice of 0.5 μm is represented for easy visualization of mitochondrial network. Scale bar: 5 μm. (G,H) Mitochondrial morphology analysis is shown for the abovementioned genotypes (G). Bar diagrams show quantification of ProPO positive cell fraction in different lobes of the same genotypes (H). Error bars represent SEM. The values have been classified as normal (0–0.005), moderately increased (0.005–0.02) and highly increased (>0.02). n represents number of individual lymph gland lobes analyzed, and N represents number of larvae for each genotype. One-way ANOVA was performed to determine statistical significance for mito-GFP quantitation while Kruskal-Wallis test was performed for analysis of crystal cell fraction. *P < 0.05, **P < 0.01, ***P < 0.001, ns: non-significant. (I) Schematic representation of the effect of mitochondrial morphology and dynamics on blood cell differentiation. Asrij is a hub that maintains the balance (blue arrowhead) between mitochondrial fission and fusion to regulate progenitor maintenance and crystal cell differentiation. Arrows indicate activation. T symbol indicates inhibition. Black color indicates previously known interactions; blue color indicates effects reported in this study.

Similar articles

Cited by

References

    1. Annesley S. A., Fisher P. R. (2019). Mitochondria in health and disease. Cells 8:680. 10.3390/cells8070680 - DOI - PMC - PubMed
    1. Anso E., Weinberg S. E., Diebold L. P., Thompson B. J., Malinge S., Schumacker P. T., et al. (2017). The mitochondrial respiratory chain is essential for haematopoietic stem cell function. Nat. Cell Biol. 19 614–625. 10.1038/ncb3529 - DOI - PMC - PubMed
    1. Antonicka H., Lin Z. Y., Janer A., Aaltonen M. J., Weraarpachai W., Gingras A. C., et al. (2020). A high-density human mitochondrial proximity interaction network. Cell Metab. 32 479–497.e9. 10.1016/j.cmet.2020.07.017 - DOI - PubMed
    1. Atkins K., Dasgupta A., Chen K. H., Mewburn J., Archer S. L. (2016). The role of Drp1 adaptor proteins MiD49 and MiD51 in mitochondrial fission: implications for human disease. Clin. Sci. (Lond.) 130 1861–1874. 10.1042/CS20160030 - DOI - PubMed
    1. Banerjee U., Girard J. R., Goins L. M., Spratford C. M. (2019). Drosophila as a genetic model for hematopoiesis. Genetics 211 367–417. 10.1534/genetics.118.300223 - DOI - PMC - PubMed

LinkOut - more resources