. 2021 Sep;31(9):1646-1662.
doi: 10.1101/gr.274563.120. Epub 2021 Jul 19.

A universal framework for detecting cis-regulatory diversity in DNA regions

Affiliations

A universal framework for detecting cis-regulatory diversity in DNA regions

Anushua Biswas et al. Genome Res. 2021 Sep.

Abstract

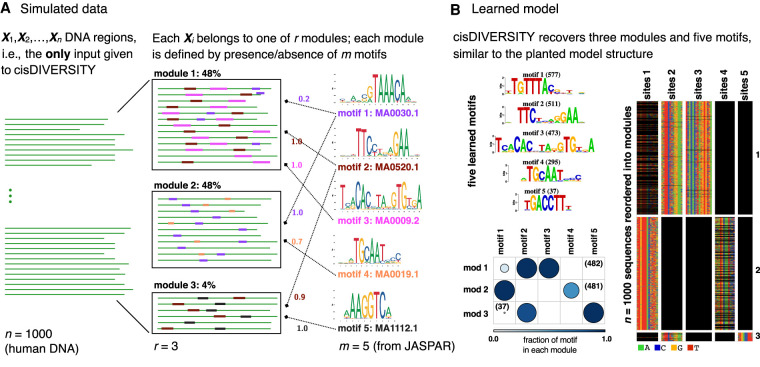
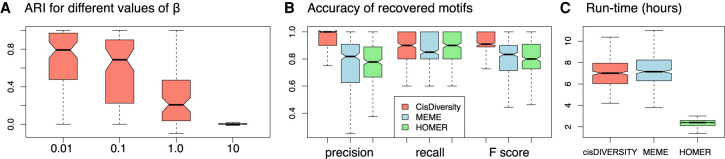
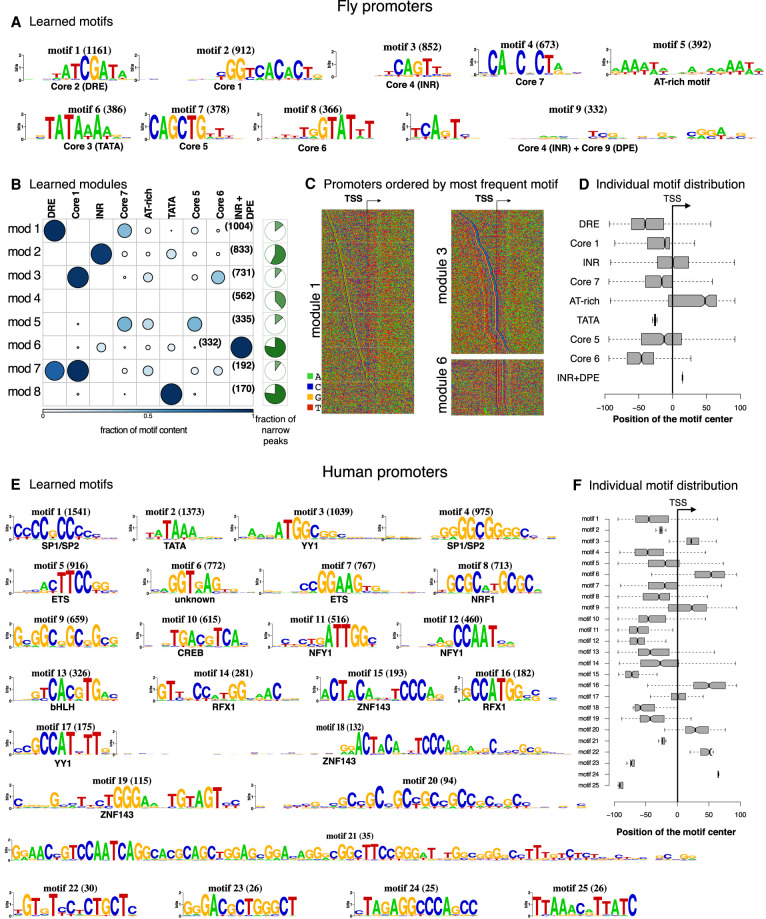
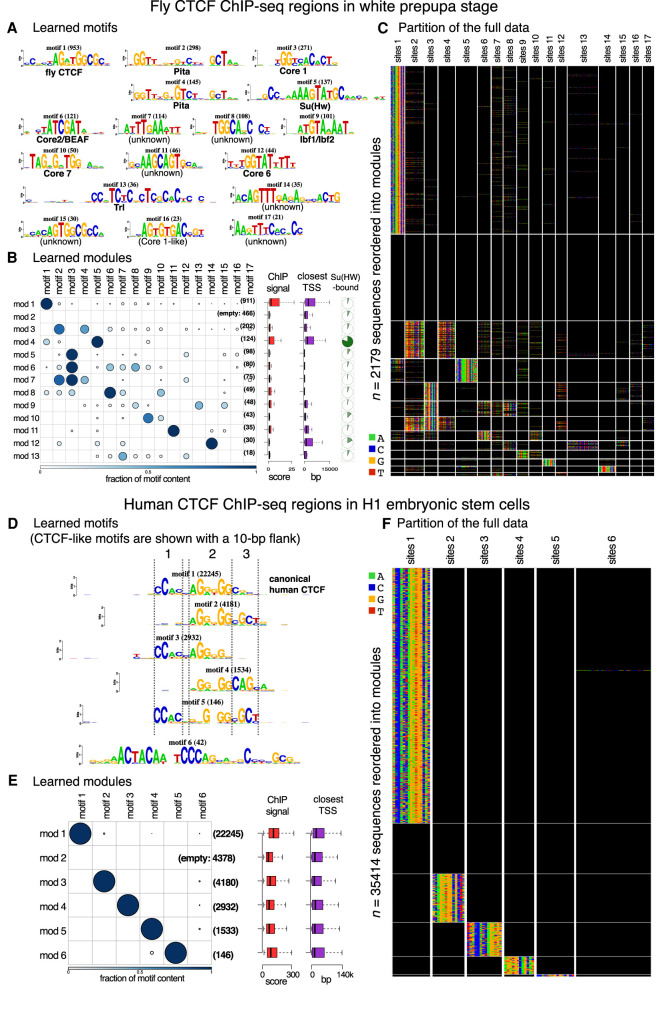
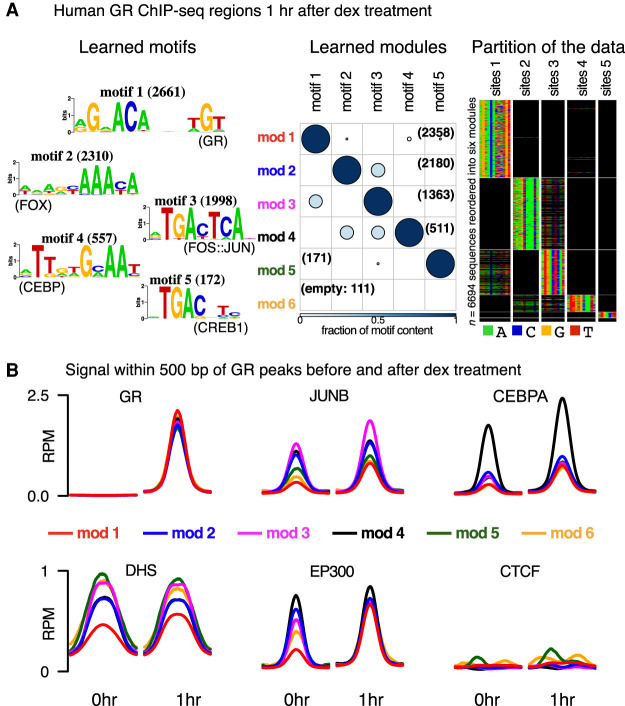
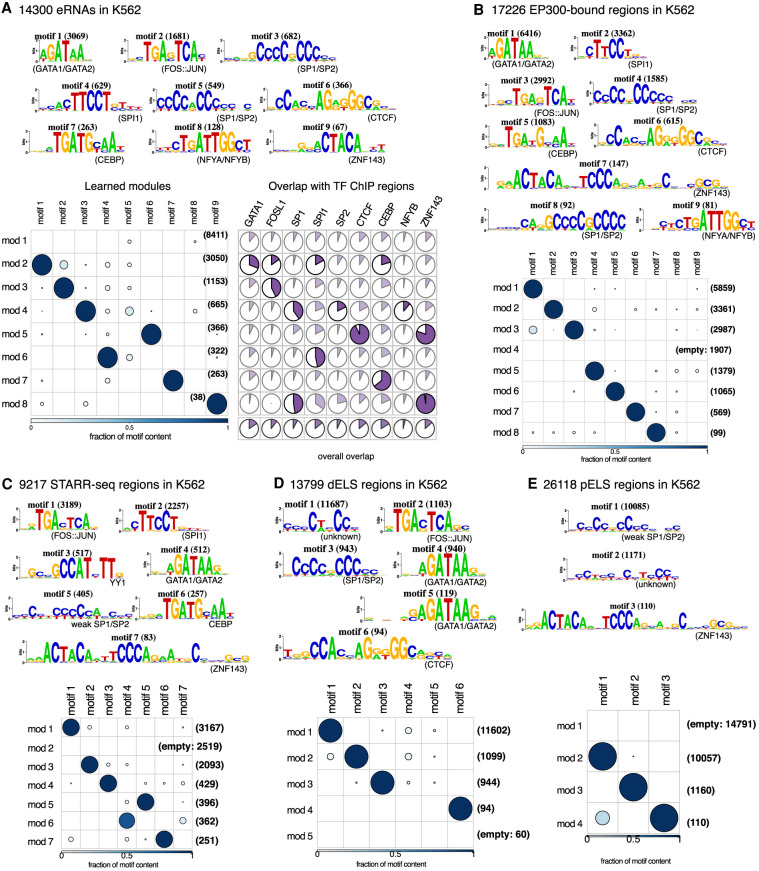
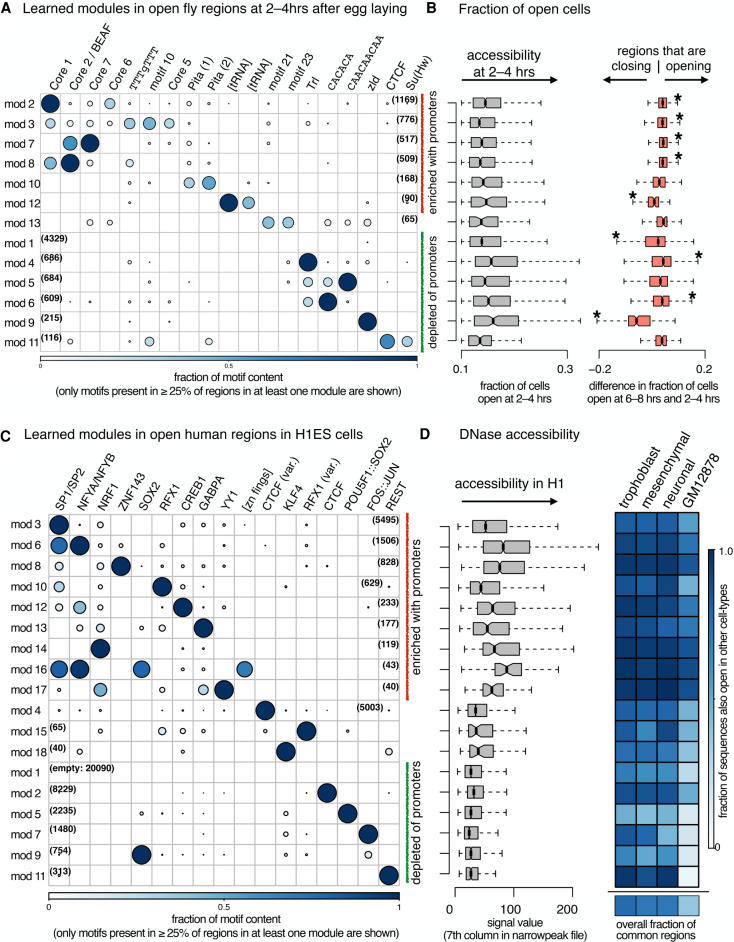
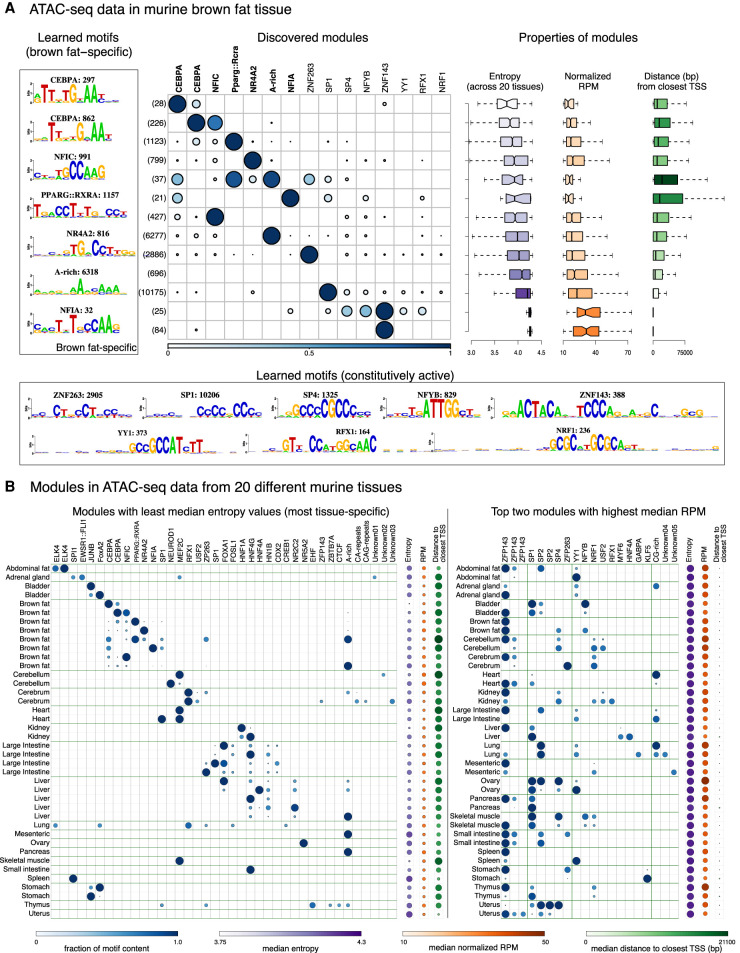
High-throughput sequencing-based assays measure different biochemical activities pertaining to gene regulation, genome-wide. These activities include transcription factor (TF)-DNA binding, enhancer activity, open chromatin, and more. A major goal is to understand underlying sequence components, or motifs, that can explain the measured activity. It is usually not one motif but a combination of motifs bound by cooperatively acting proteins that confers activity to such regions. Furthermore, regions can be diverse, governed by different combinations of TFs/motifs. Current approaches do not take into account this issue of combinatorial diversity. We present a new statistical framework, cisDIVERSITY, which models regions as diverse modules characterized by combinations of motifs while simultaneously learning the motifs themselves. Because cisDIVERSITY does not rely on knowledge of motifs, modules, cell type, or organism, it is general enough to be applied to regions reported by most high-throughput assays. For example, in enhancer predictions resulting from different assays-GRO-cap, STARR-seq, and those measuring chromatin structure-cisDIVERSITY discovers distinct modules and combinations of TF binding sites, some specific to the assay. From protein-DNA binding data, cisDIVERSITY identifies potential cofactors of the profiled TF, whereas from ATAC-seq data, it identifies tissue-specific regulatory modules. Finally, analysis of single-cell ATAC-seq data suggests that regions open in one cell-state encode information about future states, with certain modules staying open and others closing down in the next time point.


Figures

Figure 1.
Figure 1.
cisDIVERSITY. (A) DNA regions reported by the experiment are given as input to cisDIVERSITY. In this simulation, the n = 1000 regions are a mixture of three kinds of regions: Each region resembles one of r = 3 regulatory modules. Each module can be represented in terms of the probability of occurrence of m = 5 motifs. For example, motif 1 is present in all sequences of module 2, 20% of sequences in module 1, but not at all in module 3. In contrast, motif 4 is present only in module 2 and that, too, only in 70% of the its sequences. (B) cisDIVERSITY is run with upper bounds of r ≤ 10 and m ≤ 20. cisDIVERSITY learns the planted structure in the data set. The output has three components. First is the set of motifs that are learned, second (below) is r × m Bernoulli distributions describing the learned modules, and the third is an image matrix of the data, where each DNA sequence is a row and the sites corresponding to each motif are represented in the column. If a site is absent, those cells in the column are shown in black. cisDIVERSITY recovers the five motifs (motifs 1 and 3 are the reverse complements of the planted motifs) and the three modules to a great extent. The slight variability in the number of sites and sequences in each module is expected owing to the stochastic nature of both, the PWMs as well as the learning algorithm.
Figure 2.
Figure 2.
Performance on 320 simulated data sets. (A) Recovery of modules. Low values of beta result into modules with more extreme (zero or one) probability distributions of motifs. This is where cisDIVERSITY does better in recovering the planted modules. For beta = 10, the performance with respect to recovery of modules is similar to what a random clustering approach would do. (B) Recovery of motifs. Precision, recall, and F-score of recovered motifs across the 320 data sets for three different programs. (C) Time taken. All programs were run on a single core (Methods).
Figure 3.
Figure 3.
Promoter modules in fly and human. (A) cisDIVERSITY identifies 24 motifs in fly promoter data, but only the nine that contribute to at least 20% of some module are shown here. Core motifs are numbered according to the method of Ohler et al. (2002). (B) Eight modules are learned. The fraction of sequences in each module that are focused promoters, namely, have a narrow peak are shown in green. (C) Three representative modules are shown as sequence heat maps sorted based on the position of the most frequently occurring motif. Module 1 contains DRE, which is visible owing to the manner in which the sequences were ordered, but Core 7, which is present in >40% of the sequences, is not visible because it has no clear positional relationship with DRE or the TSS. The weak presence of the AT-rich motif downstream from the TSS is, however, visible. In contrast, module 3 displays a clear relationship between Core 1 and Core 6: Core 6 is present about 20 bases upstream of Core 1 and is especially prominent when Core 1 is close to the TSS. Module 6 is largely composed of INR + DPE but also contains the TATA box specifically when the INR + DPE is a few bases downstream from the TSS. (D) Each motif has a distinct distribution about the TSS. (E) cisDIVERSITY identifies 25 motifs in pooled human promoter data, with motifs 21–25 contributing on one module with TSSs of 37 zinc finger genes. All the other motifs are strand invariant, except for motif 2 (TATA) and motif 6 (unknown). (F) Each motif here too has a distinct distribution about the TSS.
Figure 4.
Figure 4.
CTCF displays contrasting diversity in fly and human. (AC) cisDIVERSITY identifies 17 motifs and 13 modules in the fly CTCF data. Motif 1 shown in a red box is the canonical fly CTCF motif. (DF) cisDIVERSITY identifies only six motifs and six modules in the human CTCF data. Again, motif 1 in the red box matches the canonical vertebrate CTCF motif. Motifs 2–5 resemble the vertebrate CTCF but differ at one of three parts denoted with dotted lines. These motifs are shown with 10-bp flanks to ensure that they are genuine variants of the motif.
Figure 5.
Figure 5.
Diverse signals discovered in GR-bound ChIP-seq regions. (A) cisDIVERSITY identifies six modes and five motifs in the GR ChIP-seq regions. (B) The average DNase hypersensitivity signal and input-subtracted ChIP-seq signal in reads per million (RPM) of five TFs—GR, JUNB, CEBPA, EP300, and CTCF—before and after treatment at the GR-bound regions are shown for each module.
Figure 6.
Figure 6.
cisDIVERSITY run on putative enhancers in K562. (A) On distant eRNAs, overlap with ChIP-seq data is significant (hypergeometric P < 10−4; shown in bold) in modules that contain the matching TF motif. Note that in some cases the overlap looks large but does not show up as significant, because the hypergeometric test corrects for the sizes of the overlaps and the modules. (B) Similar motifs are found in EP300 ChIP-seq data. (C) In STARR-seq peaks, YY1 is additionally discovered. CTCF and NFYA/NFYB are not enriched. (D,E) Distant (D) and proximal enhancer-like sequences (E) deduced from chromatin signatures have fewer motif-like signatures. cisDIVERSITY run on putative enhancers in K562.
Figure 7.
Figure 7.
cisDIVERSITY run on open regions. (A) Thirteen modules and 28 motifs (Supplemental Fig. S13) are learned on ATAC-seq regions, which are open in at least 10% of the cells probed 2–4 h after egg laying. Only the 19 motifs that contribute to at least a quarter of the sequences in some module are shown here for clarity. Modules are reordered: The red and green modules are significantly (hypergeometric P < 10−4) enriched with promoters and depleted of them, respectively. (B) Gray indicates there are only a few differences in the fraction of cells open within each module. Orange indicates modules 2, 3, 7, 8, 4, and 6 are significantly more open in the cells 6–8 h after egg-laying, whereas modules 12, 1, and 9 are closing at that time point. (C) Eighteen modules and 21 motifs (Supplemental Fig. S14) are learned on DNase-seq regions in H1 ESCs. Again, only the motifs appearing in a quarter of sequences of some module are shown here. Red and green modules are as in A. (D) Gray indicates promoter modules have a higher DNase signal in general, but there are variations among them. Blue indicates the fraction of each module (and total below) that is also open in trophoblast, mesenchymal, and neuronal stem cells (all derived from H1 ESCs), and GM12878 shows considerable variation across modules and cell types.
Figure 8.
Figure 8.
cisDIVERSITY run on accessible regions in mouse tissues. (A) Thirteen modules are learned in ATAC-seq regions from the brown fat tissue, sorted according to median entropy (most brown fat–specific on top). The 15 discovered motifs can be split into two sets: those that are enriched in tissue-specific regions, that is, those with median entropy value less than 4.0, and those that are constitutively active. Boxplots on the right indicate the relationship between tissue specificity, accessibility, and proximity to TSSs. (B) Left panel shows modules with the lowest median entropy for each tissue. Many tissues have multiple modules with lower than 4.0 median values: All such modules are shown. Motifs that are present in at least 10% of the sequences in any module are shown. The right panel shows the top two modules based on highest median RPM values per tissue. Median entropy, RPM, and distance to closest TSS are displayed on the right for each module. TOMTOM matches were used to assign putative TF identities to motifs and combined across the cisDIVERSITY individual runs.

Similar articles

Cited by

References

    1. Agrawal A, Sambare SV, Narlikar L, Siddharthan R. 2018. THiCweed: fast, sensitive detection of sequence features by clustering big datasets. Nucleic Acids Res 46: e29. 10.1093/nar/gkx1251 - DOI - PMC - PubMed
    1. Andersson R, Gebhard C, Miguel-Escalada I, Hoof I, Bornholdt J, Boyd M, Chen Y, Zhao X, Schmidl C, Suzuki T, et al.2014. An atlas of active enhancers across human cell types and tissues. Nature 507: 455–461. 10.1038/nature12787 - DOI - PMC - PubMed
    1. Arbel H, Basu S, Fisher WW, Hammonds AS, Wan KH, Park S, Weiszmann R, Booth BW, Keranen SV, Henriquez C, et al.2019. Exploiting regulatory heterogeneity to systematically identify enhancers with high accuracy. Proc Natl Acad Sci 116: 900–908. 10.1073/pnas.1808833115 - DOI - PMC - PubMed
    1. Azofeifa JG, Allen MA, Hendrix JR, Read T, Rubin JD, Dowell RD. 2018. Enhancer RNA profiling predicts transcription factor activity. Genome Res 28: 334–344. 10.1101/gr.225755.117 - DOI - PMC - PubMed
    1. Bailey TL, Elkan C. 1994. Fitting a mixture model by expectation maximization to discover motifs in biopolymers. Proc Int Conf Intell Syst Mol Biol 2:28–36. - PubMed

Publication types

MeSH terms

LinkOut - more resources