CD137 and PD-L1 targeting with immunovirotherapy induces a potent and durable antitumor immune response in glioblastoma models
- PMID: 34281988
- PMCID: PMC8291319
- DOI: 10.1136/jitc-2021-002644
CD137 and PD-L1 targeting with immunovirotherapy induces a potent and durable antitumor immune response in glioblastoma models
Erratum in
-
Correction: CD137 and PD-L1 targeting with immunovirotherapy induces a potent and durable antitumor immune response in glioblastoma models.J Immunother Cancer. 2021 Aug;9(8):1. doi: 10.1136/jitc-2021-002644corr1. J Immunother Cancer. 2021. PMID: 34389620 Free PMC article. No abstract available.
Abstract
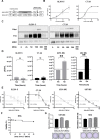
Background: Glioblastoma (GBM) is a devastating primary brain tumor with a highly immunosuppressive tumor microenvironment, and treatment with oncolytic viruses (OVs) has emerged as a promising strategy for these tumors. Our group constructed a new OV named Delta-24-ACT, which was based on the Delta-24-RGD platform armed with 4-1BB ligand (4-1BBL). In this study, we evaluated the antitumor effect of Delta-24-ACT alone or in combination with an immune checkpoint inhibitor (ICI) in preclinical models of glioma.
Methods: The in vitro effect of Delta-24-ACT was characterized through analyses of its infectivity, replication and cytotoxicity by flow cytometry, immunofluorescence (IF) and MTS assays, respectively. The antitumor effect and therapeutic mechanism were evaluated in vivo using several immunocompetent murine glioma models. The tumor microenvironment was studied by flow cytometry, immunohistochemistry and IF.
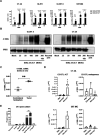
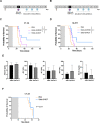
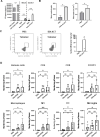
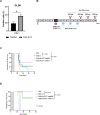
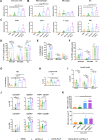
Results: Delta-24-ACT was able to infect and exert a cytotoxic effect on murine and human glioma cell lines. Moreover, Delta-24-ACT expressed functional 4-1BBL that was able to costimulate T lymphocytes in vitro and in vivo. Delta-24-ACT elicited a more potent antitumor effect in GBM murine models than Delta-24-RGD, as demonstrated by significant increases in median survival and the percentage of long-term survivors. Furthermore, Delta-24-ACT modulated the tumor microenvironment, which led to lymphocyte infiltration and alteration of their immune phenotype, as characterized by increases in the expression of Programmed Death 1 (PD-1) on T cells and Programmed Death-ligand 1 (PD-L1) on different myeloid cell populations. Because Delta-24-ACT did not induce an immune memory response in long-term survivors, as indicated by rechallenge experiments, we combined Delta-24-ACT with an anti-PD-L1 antibody. In GL261 tumor-bearing mice, this combination showed superior efficacy compared with either monotherapy. Specifically, this combination not only increased the median survival but also generated immune memory, which allowed long-term survival and thus tumor rejection on rechallenge.
Conclusions: In summary, our data demonstrated the efficacy of Delta-24-ACT combined with a PD-L1 inhibitor in murine glioma models. Moreover, the data underscore the potential to combine local immunovirotherapy with ICIs as an effective therapy for poorly infiltrated tumors.
Keywords: brain neoplasms; oncolytic viruses.
© Author(s) (or their employer(s)) 2021. Re-use permitted under CC BY. Published by BMJ.
Conflict of interest statement
Competing interests: CG-M and JF report ownership interest (including patents) in DNATrix. MMA has a research grant from DNAtrix not related to this work.
Figures
Similar articles
-
Hemagglutinating virus of Japan-envelope containing programmed cell death-ligand 1 siRNA inhibits immunosuppressive activities and elicits antitumor immune responses in glioma.Cancer Sci. 2021 Jan;112(1):81-90. doi: 10.1111/cas.14721. Epub 2020 Nov 25. Cancer Sci. 2021. PMID: 33155337 Free PMC article.
-
RCAd-LTH-shPD-L1, a double-gene recombinant oncolytic adenovirus with enhanced antitumor immunity, increases lymphocyte infiltration and reshapes the tumor microenvironment.J Immunother Cancer. 2024 Jan 11;12(1):e007171. doi: 10.1136/jitc-2023-007171. J Immunother Cancer. 2024. PMID: 38212125 Free PMC article.
-
Glioblastoma-Derived IL6 Induces Immunosuppressive Peripheral Myeloid Cell PD-L1 and Promotes Tumor Growth.Clin Cancer Res. 2019 Jun 15;25(12):3643-3657. doi: 10.1158/1078-0432.CCR-18-2402. Epub 2019 Mar 1. Clin Cancer Res. 2019. PMID: 30824583 Free PMC article.
-
Targeting the PD-1/PD-L1 pathway in glioblastoma multiforme: Preclinical evidence and clinical interventions.Int Immunopharmacol. 2021 Apr;93:107403. doi: 10.1016/j.intimp.2021.107403. Epub 2021 Feb 12. Int Immunopharmacol. 2021. PMID: 33581502 Review.
-
PD-L1/PD-1 Axis in Glioblastoma Multiforme.Int J Mol Sci. 2019 Oct 28;20(21):5347. doi: 10.3390/ijms20215347. Int J Mol Sci. 2019. PMID: 31661771 Free PMC article. Review.
Cited by
-
The emerging field of viroimmunotherapy for pediatric brain tumors.Neuro Oncol. 2024 Nov 4;26(11):1981-1993. doi: 10.1093/neuonc/noae160. Neuro Oncol. 2024. PMID: 39148489 Review.
-
Novel Therapies in Glioblastoma Treatment: Review of Glioblastoma; Current Treatment Options; and Novel Oncolytic Viral Therapies.Med Sci (Basel). 2023 Dec 23;12(1):1. doi: 10.3390/medsci12010001. Med Sci (Basel). 2023. PMID: 38249077 Free PMC article. Review.
-
Advances in immunotherapy for glioblastoma multiforme.Front Immunol. 2022 Oct 12;13:944452. doi: 10.3389/fimmu.2022.944452. eCollection 2022. Front Immunol. 2022. PMID: 36311781 Free PMC article. Review.
-
Limited Effects of Class II Transactivator-Based Immunotherapy in Murine and Human Glioblastoma.Cancers (Basel). 2023 Dec 30;16(1):193. doi: 10.3390/cancers16010193. Cancers (Basel). 2023. PMID: 38201622 Free PMC article.
-
Local Treatment of a Pediatric Osteosarcoma Model with a 4-1BBL Armed Oncolytic Adenovirus Results in an Antitumor Effect and Leads to Immune Memory.Mol Cancer Ther. 2022 Mar 1;21(3):471-480. doi: 10.1158/1535-7163.MCT-21-0565. Mol Cancer Ther. 2022. PMID: 34965961 Free PMC article.
References
Publication types
MeSH terms
Substances
Grants and funding
LinkOut - more resources
Full Text Sources
Research Materials
Miscellaneous
