. 2021 Jul 1;22(13):7153.
doi: 10.3390/ijms22137153.

Identification of Novel miRNAs and Their Target Genes in the Response to Abscisic Acid in Arabidopsis

Affiliations

Identification of Novel miRNAs and Their Target Genes in the Response to Abscisic Acid in Arabidopsis

Syed Muhammad Muntazir Mehdi et al. Int J Mol Sci. .

Abstract

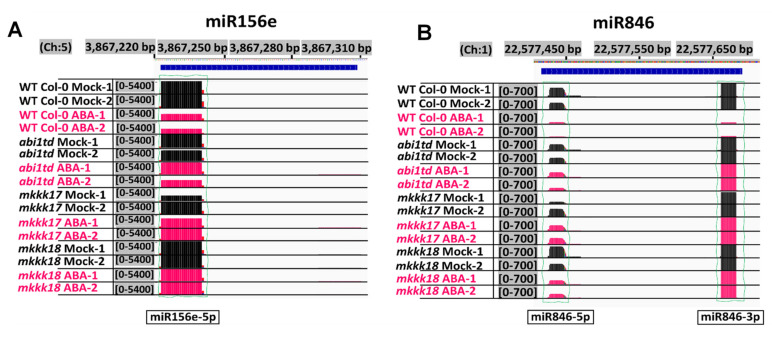
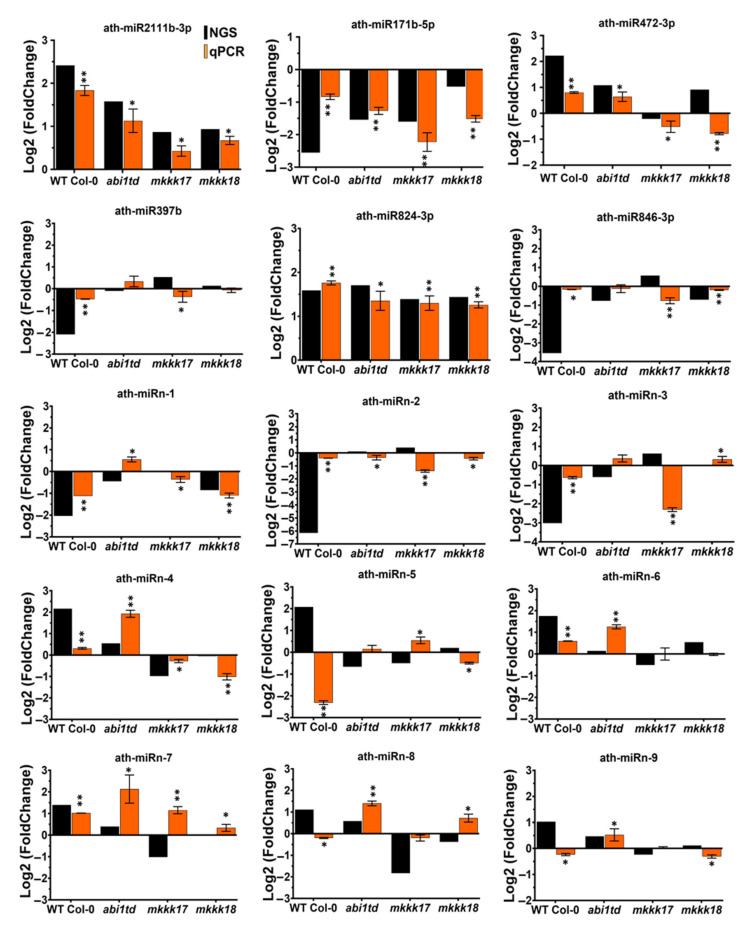
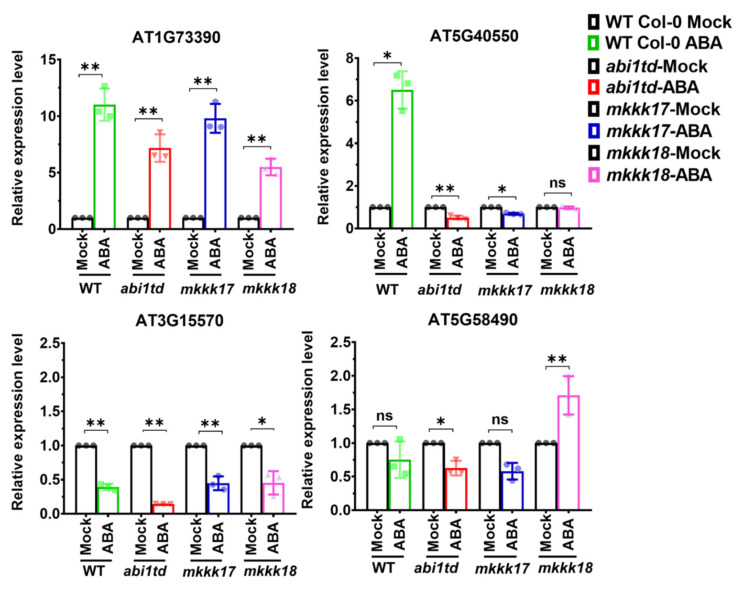
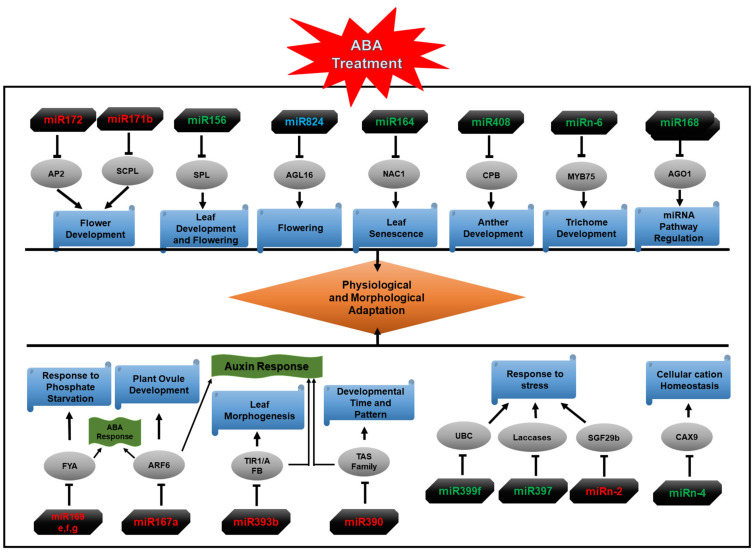
miRNAs are involved in various biological processes, including adaptive responses to abiotic stress. To understand the role of miRNAs in the response to ABA, ABA-responsive miRNAs were identified by small RNA sequencing in wild-type Arabidopsis, as well as in abi1td, mkkk17, and mkkk18 mutants. We identified 10 novel miRNAs in WT after ABA treatment, while in abi1td, mkkk17, and mkkk18 mutants, three, seven, and nine known miRNAs, respectively, were differentially expressed after ABA treatment. One novel miRNA (miRn-8) was differentially expressed in the mkkk17 mutant. Potential target genes of the miRNA panel were identified using psRNATarget. Sequencing results were validated by quantitative RT-PCR of several known and novel miRNAs in all genotypes. Of the predicted targets of novel miRNAs, seven target genes of six novel miRNAs were further validated by 5' RLM-RACE. Gene ontology analyses showed the potential target genes of ABA-responsive known and novel miRNAs to be involved in diverse cellular processes in plants, including development and stomatal movement. These outcomes suggest that a number of the identified miRNAs have crucial roles in plant responses to environmental stress, as well as in plant development, and might have common regulatory roles in the core ABA signaling pathway.

Keywords: ABI1 PP2C; Arabidopsis thaliana; MAPKKK17; MAPKKK18; abscisic acid; miRNA.


Conflict of interest statement

No conflict of interest is declared.

Figures

Figure 1
Figure 1
Length distribution of small RNAs. Length distribution of small RNAs in samples of Arabidopsis WT Col-0, abi1td, mkkk17, and mkkk18 mutants before or after four hours of 100 µM ABA treatment (mock- and 100 µM ABA-treated). The X-axis represents the small RNA length (nucleotides) and the Y-axis represents the percentage of small RNA reads.
Figure 2
Figure 2
Venn diagram showing the common and specific total small RNAs identified expressed in all samples of ABA-treated vs. mock-treated Arabidopsis WT Col-0, abi1td, mkkk17, and mkkk18 mutants.
Figure 3
Figure 3
Secondary structures for the novel miRNA precursors. Predicted hairpin secondary structures for the potential novel miRNA precursors of (A) miRn-1 (B) miRn-3, (C) miRn-7, and (D) miRn-8. Nucleotide bases of mature miRNA are highlighted in light blue. The actual size of each putative precursor might differ slightly from its shown length since it was not identified experimentally. The computed minimum free energy (MFE) of the thermodynamic ensemble is reported. RNAstructure version 6.2 software was employed to evaluate the stem-loop structure with default parameter settings.
Figure 4
Figure 4
Distribution and expression pattern of known and novel miRNAs in all libraries. The hierarchical clustering analysis by heatmap of ABA-responsive miRNAs from samples of ABA-treated vs. mock-treated Arabidopsis WT Col-0, abi1td, mkkk17, and mkkk18 mutants. Heatmap showing hierarchical clustering of 30 differently expressed miRNAs are displayed by distance and complete cluster methods as a measurement of similarity from samples of ABA-treated vs. mock-treated Arabidopsis WT Col-0, abi1td, mkkk17, and mkkk18 mutants. The data in the heatmap are the value of log2 (fold change). Red and blue indicate upregulation and downregulation of miRNAs, respectively.
Figure 5
Figure 5
ABA-responsive small RNA clusters. Dispersion plot shows how the dispersion (variance) estimates are shrunk from the gene-wise values (black dots) toward the fitted estimates in (A) WT Col-0, (B) abi1td, (C) mkkk17, and (D) mkkk18 mutants after ABA induction. Values in blue are the final values used in testing. (E) A three-dimensional PCA plot of small RNA-Seq libraries with or without ABA induction of all genotypes of Arabidopsis WT Col-0, abi1td, mkkk17, and mkkk18 mutants.
Figure 6
Figure 6
Common and specific miRNAs display differential expression between analyzed samples. Expression profiles and prediction comparison for miRNAs. (A) Venn diagrams show the common and specific differentially expressed known and novel up- and downregulated miRNAs or unchanged miRNAs expressed in Arabidopsis WT Col-0, abi1td, mkkk17, and mkkk18 mutants before or after four hours of 100 µM ABA treatment (mock- and ABA-treated). The fold change (ABA-treated vs. mock) is log2N; log2N ≥ 1 is upregulated; between 0 < |log2N| < 1 is unchanged expression; and log2N ≤ −1 is downregulated. Adjusted p-values ≤ 0.05. Green-colored miRNAs show upregulated miRNAs in all genotypes. Red color shows downregulated miRNAs in all genotypes. Light blue color shows expression of miRNAs expressing differently in all genotypes. (B) miR824 and (C) miR169k show the abundance expressed in Arabidopsis WT Col-0, abi1td, mkkk17, and mkkk18 mutants. Black bars indicate the number of aligned reads in mock samples, and red bars indicate the number of aligned reads in 4 h of ABA-treated samples; therefore, coverage at the specific positions and abundance can be compared between genotypes after 4 h of 100 µM ABA induction, and their genotype specificity can be observed after ABA in all genotypes with 3′, 5′-mature variants of these miRNAs. (Ch with numbers means chromosome number).
Figure 7
Figure 7
Expression profiles of the known miRNAs’ abundance in Arabidopsis WT Col-0, abi1td, mkkk17, and mkkk18 mutants with or without ABA induction. These show the abundance of miRNAs (A) miR156e and (B) miR846 expressed in Arabidopsis WT Col-0, abi1td, mkkk17, and mkkk18 mutants. Black bars indicate the number of aligned reads in mock samples and red bars indicate the number of aligned reads in 4 h of 100 µM ABA-treated samples; therefore, coverage at the specific positions and abundance can be compared between genotypes after 4 h of ABA induction. Strong or weak expression can be observed for these miRNAs in all genotypes for the 3′, 5′-mature variants of these miRNAs. (Ch with numbers means chromosome number).
Figure 8
Figure 8
Validation and comparison of RNA sequencing results by real-time PCR. Comparisons between real-time validation and gene expression profiling data of randomly selected known and novel miRNAs in Arabidopsis WT Col-0, abi1td, mkkk17, and mkkk18 mutants before or after four hours of 100 µM ABA treatment (mock- and ABA-treated). The x-axis represents genotype names, while the y-axis represents the relative expression level of miRNAs. The expression levels of miRNAs are normalized to the level of SnoR66. Black bars represent the expression from log2 (fold change) of the NGS data, while orange bars represent the qPCR log2 (fold change) values. Data from qRT-PCR are means of three biological replicates with each having three technical replicates. Error bars represent ±SD (standard deviation) from triplicates. Student’s t-test was performed on mock-treated and four hours of 100 µM ABA-treated results of qRT-PCR, and the statistically significant treatments are marked with * (p-value ≤ 0.05), ** (p-value ≤ 0.001).
Figure 9
Figure 9
miRNA mapping and cleavage site determination through 5′ RLM RACE. (A) Gel images of 5′ RLM-RACE showing the amplified products (RLM-RACE second round PCR products) after consecutive PCR reactions. The migrating band in each lane (green horizontal arrows) was purified for DNA sequencing. CT: negative control for PCR; M: DNA molecular weight size marker. (B) The targeted mRNA section and miRNA sequences, along with mismatch(es), if any, are shown as the empty region or with dotted line. Grey boxes show CDS regions of miRNA target genes. Yellow boxes show 5′, 3′ UTR ends of miRNA target genes. Black boxes show the predicted region of miRNA target site. The enlarged portion shows the pairing between miRNAs and the target sites. Each top strand depicts an miRNA, and each bottom strand depicts complementary target site on the anti-parallel miRNA. The 5′ ends of the cleaved product determined by sequencing are indicated by the vertical arrowheads, along with the numbers of clones analyzed for each target gene. The horizontal red arrowheads indicate the gene-specific primer sites used for 5′ RLM-RACE. Numbers in brackets show nucleotides position of target gene cDNAs.
Figure 10
Figure 10
Relative transcript abundance of selected target genes of novel miRNAs identified as ABA-responsive in this study by RT-qPCR. Target gene expression profiling data of randomly selected target genes of novel miRNAs in Arabidopsis WT Col-0, abi1td, mkkk17, and mkkk18 mutants before or after 4 h of 100 µM ABA treatment (mock- and ABA-treated). The x-axis represents genotype names, while the y-axis represents the relative expression level of miRNA target genes. The expression levels are normalized to the level of 18S as internal control. Data from qRT-PCR are means of three biological replicates, each of which has three technical replicates (n = 9). Error bars represent ±SD (standard deviation) from triplicates. Student’s t-test was performed on mock- and ABA-treated results of qRT-PCR, and statistically significant treatments are marked * (p-value ≤ 0.05), ** (p-value ≤ 0.001), or ns (non-significant).
Figure 11
Figure 11
A hypothetical model of regulatory networks of ABA-responsive miRNAs and their target genes in Arabidopsis. Possible roles of known and novel ABA-induced miRNAs in different biological processes in Arabidopsis based on Gene Ontology (GO) analysis. Downregulated ABA-responsive miRNAs are shown in red, while those shown in green represent upregulated ABA-responsive miRNAs identified in this study. miRNAs labeled in green are upregulated in all genotypes; those in red are downregulated in all genotypes; miRNAs labeled in light blue are expressed differently in all genotypes. Grey ovals show target genes of miRNAs. Block/inhibitory arrows show the regulation of target gene by miRNA.

Similar articles

Cited by

References

    1. Finkelstein R.R., Gampala S.S.L., Rock C.D. Abscisic acid signaling in seeds and seedlings. Plant Cell. 2002;14:15–46. doi: 10.1105/tpc.010441. - DOI - PMC - PubMed
    1. Harris J.M. Abscisic acid: Hidden architect of root system structure. Plants. 2015;4:548–572. doi: 10.3390/plants4030548. - DOI - PMC - PubMed
    1. Danquah A., De Zélicourt A., Boudsocq M., Neubauer J., Frei Dit Frey N., Leonhardt N., Pateyron S., Gwinner F., Tamby J.P., Ortiz-Masia D., et al. Identification and characterization of an ABA-activated MAP kinase cascade in Arabidopsis thaliana. Plant J. 2015;82:232–244. doi: 10.1111/tpj.12808. - DOI - PubMed
    1. Mitula F., Tajdel M., Cieśla A., Kasprowicz-Maluśki A., Kulik A., Babula-Skowrońska D., Michalak M., Dobrowolska G., Sadowski J., Ludwików A., et al. Arabidopsis ABA-Activated Kinase MAPKKK18 is Regulated by Protein Phosphatase 2C ABI1 and the Ubiquitin-Proteasome Pathway. Plant Cell Physiol. 2015;56:2351–2367. doi: 10.1093/pcp/pcv146. - DOI - PMC - PubMed
    1. Menges M., Dóczi R., Ökrész L., Morandini P., Mizzi L., Soloviev M., Murray J.A.H., Bögre L. Comprehensive gene expression atlas for the Arabidopsis MAP kinase signalling pathways. New Phytol. 2008;179:643–662. doi: 10.1111/j.1469-8137.2008.02552.x. - DOI - PubMed

MeSH terms