. 2021 Jul 16;12(1):4354.
doi: 10.1038/s41467-021-24521-x.

SARS-CoV-2 infection induces the dedifferentiation of multiciliated cells and impairs mucociliary clearance

Affiliations

SARS-CoV-2 infection induces the dedifferentiation of multiciliated cells and impairs mucociliary clearance

Rémy Robinot et al. Nat Commun. .

Abstract

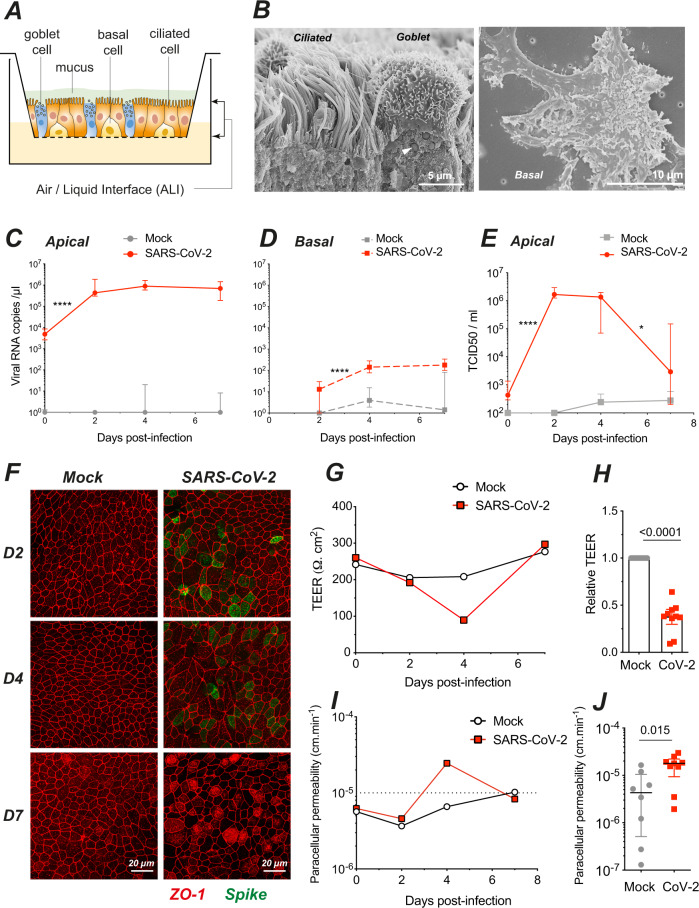
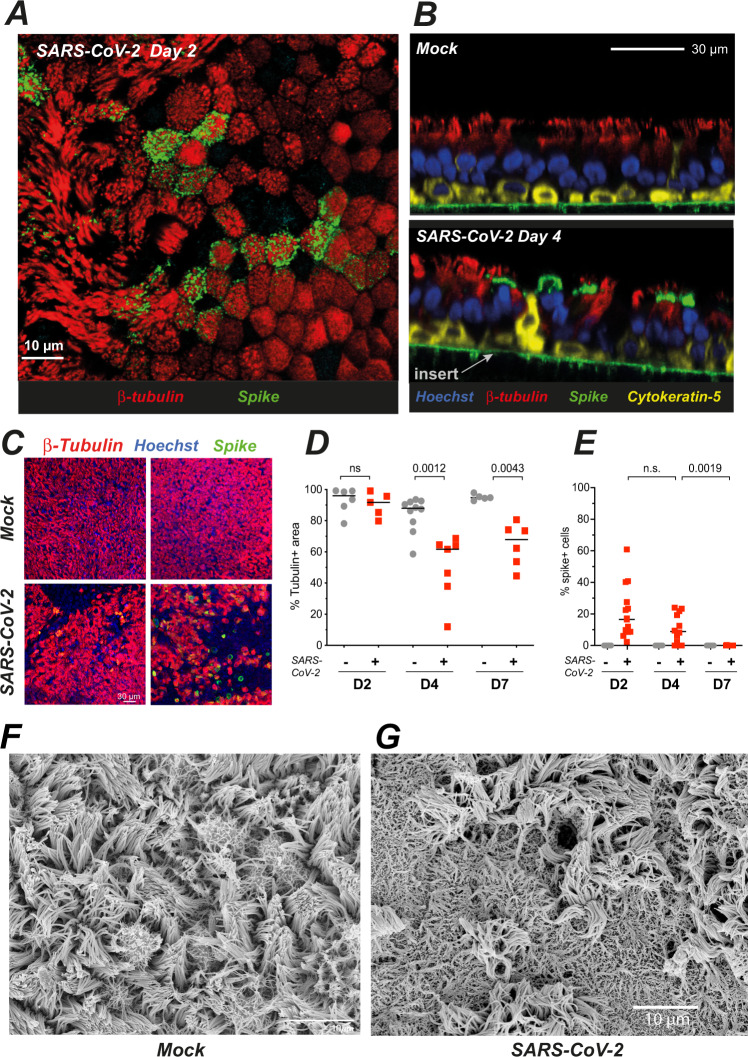
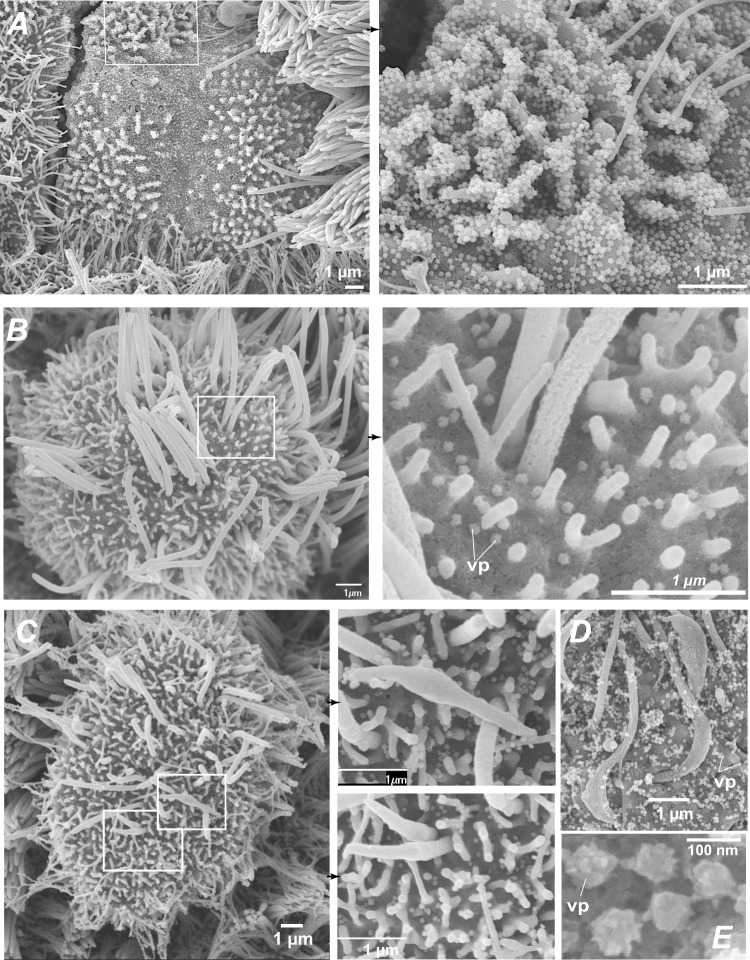
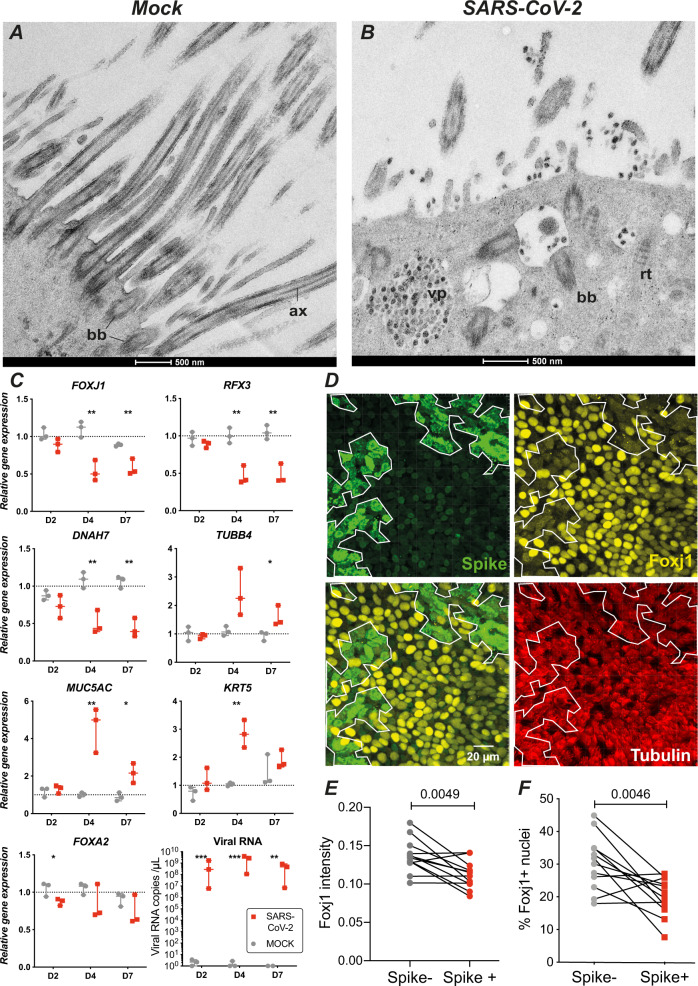
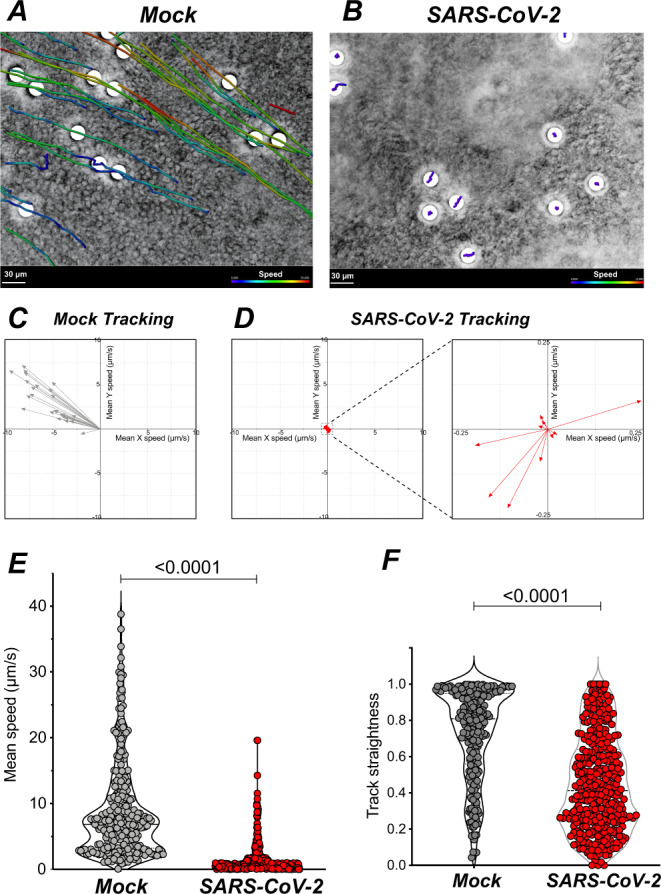
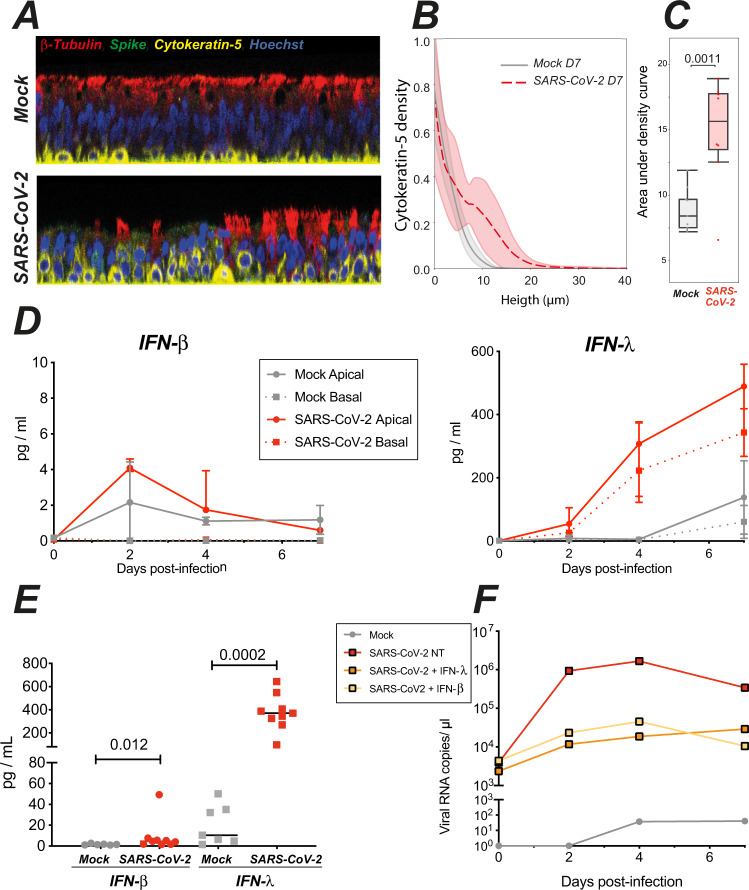
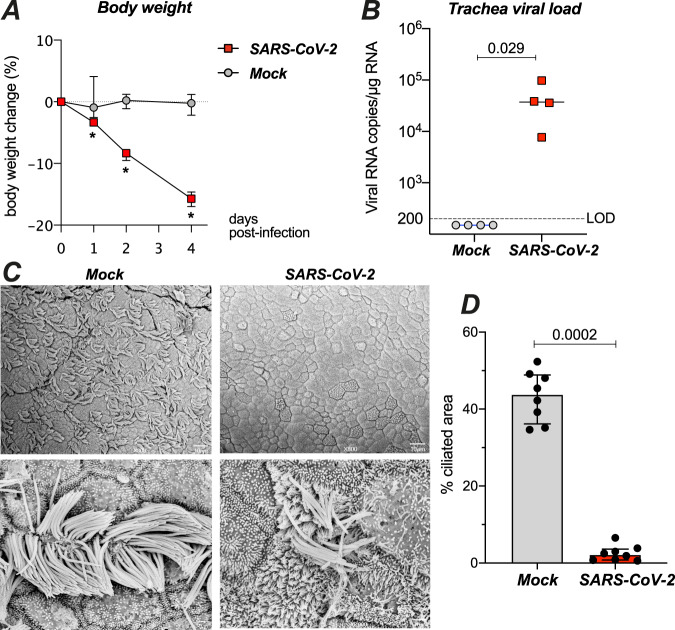
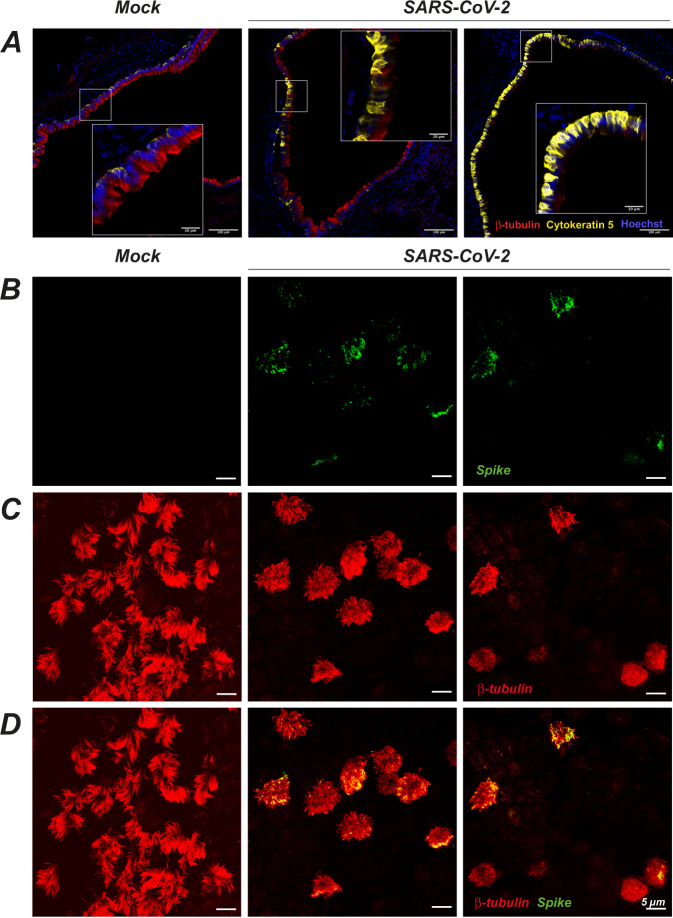
Understanding how SARS-CoV-2 spreads within the respiratory tract is important to define the parameters controlling the severity of COVID-19. Here we examine the functional and structural consequences of SARS-CoV-2 infection in a reconstructed human bronchial epithelium model. SARS-CoV-2 replication causes a transient decrease in epithelial barrier function and disruption of tight junctions, though viral particle crossing remains limited. Rather, SARS-CoV-2 replication leads to a rapid loss of the ciliary layer, characterized at the ultrastructural level by axoneme loss and misorientation of remaining basal bodies. Downregulation of the master regulator of ciliogenesis Foxj1 occurs prior to extensive cilia loss, implicating this transcription factor in the dedifferentiation of ciliated cells. Motile cilia function is compromised by SARS-CoV-2 infection, as measured in a mucociliary clearance assay. Epithelial defense mechanisms, including basal cell mobilization and interferon-lambda induction, ramp up only after the initiation of cilia damage. Analysis of SARS-CoV-2 infection in Syrian hamsters further demonstrates the loss of motile cilia in vivo. This study identifies cilia damage as a pathogenic mechanism that could facilitate SARS-CoV-2 spread to the deeper lung parenchyma.


Conflict of interest statement

The authors declare no competing interests.

Figures

Fig. 1
Fig. 1. SARS-Cov-2 infection transiently impairs epithelial barrier function in a reconstructed human bronchial epithelium.
A Schematic view of an Air/Liquid Interface (ALI) culture of a reconstructed human bronchial epithelium comprising three cell types: ciliated, goblet, and basal cells. B SEM imaging of the three cell types, with a ciliated and a goblet cell (left panel; arrowhead: mucus granule) and a basal cell (right panel). C, D SARS-CoV-2 viral load quantification in apical (C) and basal (D) culture supernatants by RT-qPCR (C: n = 7 independent experiments; D: n = 5; C, D: 1–7 replicates per experiment). E Infectious SARS-CoV-2 particles production quantified by TCID50 on Vero cells (n = 2 independent experiments, with 1–8 replicates per experiment). C–E Medians ± IQR were compared by Mann–Whitney tests; statistically significant differences between infected samples compared at adjacent days are reported (*P < 0.05, **P < 0.01, ***P < 0.001, ****P < 0.0001). Comparisons between mock and infected samples on the same day were all significant (P < 0.001), except in D and E at 7 dpi. F Visualization of tight junctions (ZO-1, red) and infection (SARS-CoV-2 spike, green) by immunofluorescence at 2, 4, and 7 dpi in n = 1 representative experiment out of 2. G–J Assessment of epithelium barrier function: Trans-Epithelial Electric Resistance (TEER) (G, H) and paracellular permeability for dextran-FITC (I, J). Panels G, I show representative experiments, while panels H, J show pooled results at 4 dpi (n = 4 independent experiments, with 1–4 replicates per experiment). Median ± IQR values were compared with Mann–Whitney tests.
Fig. 2
Fig. 2. SARS-CoV-2 preferentially targets ciliated cells and damages the ciliary layer.
A, B Confocal imaging of a SARS-CoV-2-infected epithelium at 2 dpi (A, top section) and of control (Mock) and infected epithelia at 4 dpi (B, orthogonal sections). Ciliated cells are labeled for β-tubulin IV (red), basal cells for cytokeratin-5 (yellow), nuclei for DNA (Hoechst, blue), and infected cells for the SARS-CoV-2 spike (green). The green line in 2B is due to the autofluorescence of the insert porous membrane. C, D Representative images of the β-tubulin layer at 4 dpi (C) and corresponding image analysis (D) (n = 3 independent experiments with 1–4 replicates for D4; n = 2 independent experiments with 2–3 replicates for D2 and D7; Mann–Whitney test). E Percentage % of spike+ cells, measured as (number of spike+ cell/number of nuclei) × 100 (n = 5 independent experiments with 1–5 replicates for D2 and D4; n = 3 independent experiments with 3 replicates for D7; Mann–Whitney test). F, G SEM imaging of mock-infected (E) and SARS-CoV-2-infected (F) reconstructed epithelia at 4 dpi.
Fig. 3
Fig. 3. SARS-CoV-2 infection causes an early loss of motile cilia.
A Scanning electron microscopy (SEM) image of a massively infected cell at 2 dpi (left) with a lack of cilia and an accumulation of viral particles at the surface of membrane ruffles (enlarged in right panel). B SEM image of an infected cell at 2 dpi with few remaining cilia (left) and scattered viral particles (vp) at the plasma membrane (right). C, D SEM images of infected cells at 2 dpi showing cilia abnormalities, including shortened misshapen cilia (D left, enlarged in middle panels) and crescent-shaped proximal axonemes (E). E SEM image of pleiomorphic SARS-CoV-2 viral particles.
Fig. 4
Fig. 4. SARS-CoV-2 infection perturbs ciliogenesis and induces Foxj1 downregulation.
A TEM image of a mock-infected ciliated cell with elongated axonemes (ax) and membrane proximal basal bodies (bb). B TEM image of an infected ciliated cells at 4 dpi, with viral particle (vp) accumulation, mislocalized basal bodies, and isolated rootlets (rt). lp large particle. C Quantitation of transcripts expressed in mock- and SARS-CoV-2-infected epithelia (median ± range). The expression of 8 genes was measured by qPCR in n = 3 biological replicates from different donors and compared by t-tests with false discovery rate (FDR) correction for multiple comparisons (*P < 0.05, **P < 0.01, ***P < 0.001). D Immunofluorescence analysis of epithelia at 2 dpi, after labeling for the viral spike (green), Foxj1 (yellow), and β-tubulin IV (red). The limit of the Spike+ area is reported on each panel (white line). E, F The Foxj1 mean fluorescence intensity in 3D-segmented nuclei (E) and the percentage of Foxj1+ nuclei (F) were compared in Spike− and Spike+ areas for n = 4 donors with 3 replicates per donor, using a paired t-test.
Fig. 5
Fig. 5. SARS-CoV-2 infection impairs mucociliary clearance.
A, B Representative examples of bead tracking on mock (A) and infected (B) epithelia at 7 dpi. Bead speed is color-coded in each track. C, D Vector representation of tracks from A and B showing bead speed and direction. A low bead speed is observed in infected epithelia (D, left), with an enlarged view showing non-uniform directions (D, right). E, F Bead mean speed (E) and track straightness (F) measured in mock and infected epithelia at 7 dpi (n = 3 independent experiments, with 68–118 beads tracked per sample; Mann–Whitney tests).
Fig. 6
Fig. 6. SARS-CoV-2 infection triggers epithelial defense mechanisms: basal cell mobilization and interferon induction.
A Representative confocal images from mock and infected epithelia obtained at 7 dpi and used for quantification of basal cell (cytokeratin-5+, yellow) position along the Z-axis (same color code as in 4B). B, C Quantification of basal cell mobilization by analysis of the cytokeratin-5 density profile along the Z-axis. B The mean density ± SD of 8 (SARS-CoV-2) or 9 (Mock) images from n = 3 independent experiments is shown. C Comparison of areas under the curves shown in B with an unpaired t-test. Box plots show median and interquartile range (box) and 1.5× the interquartile range (whiskers), with all points shown. D Kinetics of IFN-β (left) and IFN-λ (right) production in apical and basal supernatants of mock and infected epithelia (median ± IQR, n = 2 independent experiments, 1–4 replicates per experiment). E Quantification of interferon production in apical supernatants at 4 dpi (medians for n = 4 independent experiments, 1–4 replicates per experiment). Statistical differences between infected and mock samples were compared by the Mann–Whitney test. F Effect of interferon pretreatment on SARS-CoV-2 replication in reconstructed epithelia. Viral RNA copies were quantified in apical supernatants by qRT-PCR (n = 1 experiment).
Fig. 7
Fig. 7. SARS-CoV-2 damages the ciliary layer in the respiratory tract of Syrian golden hamsters.
A Effect of intranasal SARS-CoV-2 infection on hamster body weight (n = 4 per group; median ± IQR). Differences between groups were measured by a Mann–Whitney test (*P < 0.05). B SARS-CoV-2 viral load measured at 4 dpi in hamster trachea by RT-qPCR (n = 4 per group; medians, Mann–Whitney test). LOD limit of detection. C SEM images of tracheal epithelia from mock (left panels) and SARS-CoV-2-infected (right panels) hamsters at 4 dpi. Enlarged views of ciliated cell are shown in bottom panels. D Quantification of ciliated area in hamster tracheas imaged by SEM (SARS2: n = 3, MOCK: n = 2; 2–4 images per sample). Differences between medians ± IQR were measured by a Mann–Whitney test.
Fig. 8
Fig. 8. SARS-CoV-2 infection targets ciliated cells in the trachea of infected Syrian golden hamsters.
A Immunofluorescence imaging of hamster tracheas at 4 dpi. Ciliated cells are labeled with β-tubulin IV (red), basal cells by cytokeratin-5 (yellow), and nuclei by Hoechst (blue). Representative images are shown for a mock-infected animal (left, n = 3), and SARS-CoV-2-infected animals who received a low dose (middle, n = 2) or a high dose (right, n = 2) of virus. B–D Whole-mount immunofluorescence imaging of the tracheal epithelium of mock-infected (left) or SARS-CoV-2-infected (middle and right) hamsters at 4 dpi. Labeling for the SARS-CoV-2 spike (B, green), the ciliated cell marker β-tubulin IV (C, red), or both markers (D) are shown. The tracheal epithelium obtained in the infected animal show various degrees of cilia destruction (middle, right) depending on the area.

Similar articles

Cited by

References

    1. Zhu N, et al. A novel coronavirus from patients with pneumonia in China, 2019. N. Engl. J. Med. 2020;382:727–733. doi: 10.1056/NEJMoa2001017. - DOI - PMC - PubMed
    1. Zhou P, et al. A pneumonia outbreak associated with a new coronavirus of probable bat origin. Nature. 2020;579:270–273. doi: 10.1038/s41586-020-2012-7. - DOI - PMC - PubMed
    1. Lu R, et al. Genomic characterisation and epidemiology of 2019 novel coronavirus: implications for virus origins and receptor binding. Lancet. 2020;395:565–574. doi: 10.1016/S0140-6736(20)30251-8. - DOI - PMC - PubMed
    1. Huang C, et al. Clinical features of patients infected with 2019 novel coronavirus in Wuhan, China. Lancet. 2020;395:497–506. doi: 10.1016/S0140-6736(20)30183-5. - DOI - PMC - PubMed
    1. Guan WJ, et al. Clinical characteristics of coronavirus disease 2019 in China. N. Engl. J. Med. 2020 doi: 10.1056/NEJMoa2002032. - DOI - PMC - PubMed

Publication types