. 2021 Jul 16:10:e66662.
doi: 10.7554/eLife.66662.

Homo-oligomerization of the human adenosine A2A receptor is driven by the intrinsically disordered C-terminus

Affiliations

Homo-oligomerization of the human adenosine A2A receptor is driven by the intrinsically disordered C-terminus

Khanh Dinh Quoc Nguyen et al. Elife. .

Abstract

G protein-coupled receptors (GPCRs) have long been shown to exist as oligomers with functional properties distinct from those of the monomeric counterparts, but the driving factors of oligomerization remain relatively unexplored. Herein, we focus on the human adenosine A2A receptor (A2AR), a model GPCR that forms oligomers both in vitro and in vivo. Combining experimental and computational approaches, we discover that the intrinsically disordered C-terminus of A2AR drives receptor homo-oligomerization. The formation of A2AR oligomers declines progressively with the shortening of the C-terminus. Multiple interaction types are responsible for A2AR oligomerization, including disulfide linkages, hydrogen bonds, electrostatic interactions, and hydrophobic interactions. These interactions are enhanced by depletion interactions, giving rise to a tunable network of bonds that allow A2AR oligomers to adopt multiple interfaces. This study uncovers the disordered C-terminus as a prominent driving factor for the oligomerization of a GPCR, offering important insight into the effect of C-terminus modification on receptor oligomerization of A2AR and other GPCRs reconstituted in vitro for biophysical studies.

Keywords: E. coli; S. cerevisiae; adenosine a2a receptor; biochemistry; c-terminus; chemical biology; depletion interactions; gpcrs; intrinsically disordered regions; molecular biophysics; oligomerization; structural biology.


Conflict of interest statement

KN, MV, ES, SS, JH, NS, BM, MO, SH No competing interests declared

Figures

Figure 1.
Figure 1.. Method for collecting size-exclusion chromatography (SEC) data and assessing A2AR oligomerization.
The SEC data is recorded every second as absorbance at 280 nm. The baseline is corrected to ensure uniform fitting and integration across the peaks. The areas under the curve, resulting from a multiple-Gaussian curve fit, express the population of each oligomeric species. The reported standard errors of integration are within a 95% confidence interval and are calculated from the variance of the fit, not experimental errors. The levels of high-molecular-weight oligomer and dimer are expressed relative to the monomeric population in arbitrary units. A representative calculation defining the oligomer levels is given in the box.
Figure 1—figure supplement 1.
Figure 1—figure supplement 1.. The purity and identity of A2AR are confirmed with total protein stain and western blot.
(A) Representative total protein stain (upper panel) and western blot (lower panel) of A2AR-WT during purification. Positive ([+] ctrl) and negative ([–] ctrl) controls consist of 5 OD cell lysate of Saccharomyces cerevisiae BJ5464 cells expressing and not expressing A2AR WT, respectively. ‘IMAC FT’ indicates the flow-through from IMAC step. ‘XAC inactive’ and ‘XAC active’ indicate the fractions that do not and do bind to XAC during the ligand-affinity chromatography step. (B) Representative western blot of A2AR-WT during size-exclusion chromatography (SEC) separation. The fractions are matched to the distinct oligomeric peaks in the SEC chromatogram. Each lane on the blot is from 0.5 mL fractions eluted from a Superdex 200 10/300 GL (GE Healthcare) column. MagicMark protein ladder (LC5602) is used as the molecular weight standard.
Figure 1—figure supplement 2.
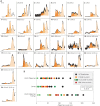
Figure 1—figure supplement 2.. Size-exclusion chromatographic traces and data distribution of all A2AR variants used in the main text of this study.
(A) Curve fitting using OriginLab of all A2AR variants used in the main text of this study, listed by the order they appear. By default, each oligomeric peak is fitted with one curve using Gaussian distribution and displayed by different color shades, with the high-molecular-weight (HMW) oligomer eluted first (dark orange), followed by the dimer (lighter orange), followed by the monomer (lightest orange). However, the HMW oligomer peak in some cases cannot be fitted with one curve and thus is fitted with two curves instead. This discrepancy can be explained by variation in HMW oligomerization order among the variants. The identity of each peak is confirmed with western blotting. The value and error from the curve fitting of each peak are given in Supplementary file 1. (B) Data distribution of all variants used in this study in comparison to five experimental replicates of A2AR-WT. The C-terminally truncated mutants are represented by different shades of green in increasing darkness corresponding to the increased length of the C-terminus, with the lightest shade representing the mutant with the shortest C-terminus (A316ΔC) and the darkest shade for the mutant with the longest C-terminus (P395ΔC). The levels of dimer and HMW oligomer are expressed relative to the monomeric population in arbitrary unit, with reported errors calculated from the variance of the fit, not experimental variation. There are significant variations in the dimer and HMW oligomer levels among the WT replicates, stemming from experimental errors. These variations are mitigated when the two parameters are added as the data distribution becomes more uniform. Also, the oligomerization levels of the WT replicates are consistently higher than the mutated and truncated variants.
Figure 2.
Figure 2.. Residue C394 helps stabilize A2AR oligomerization via disulfide bonds.
(A) The effect of C394X substitutions on A2AR oligomerization. The levels of dimer (dark colors) and high-molecular-weight oligomer (light colors) are expressed relative to the monomeric population in arbitrary units, with reported errors calculated from the variance of the fit, not experimental variation. (B) Line densitometry of western blot bands on size-exclusion chromatography (SEC)-separated dimeric populations of A2AR-WT and Q372ΔC with and without 5 mM TCEP. The level of dimer is expressed relative to the monomeric population in arbitrary units similarly to the SEC analysis. MagicMark protein ladder (LC5602) is used as the molecular weight standard.
Figure 3.
Figure 3.. Truncating the C-terminus systematically affects A2AR oligomerization.
(A) Depiction of where the truncation points are located on the C-terminus, with region 354–359 highlighted (in black) showing critical residues. (B) The levels of dimer and high-molecular-weight (HMW) oligomer are expressed relative to the monomeric population as an arbitrary unit and plotted against the residue number of the truncation sites, with reported errors calculated from the variance of the fit, not experimental variation. Region 354–359 is emphasized (in black and gray) due to a drastic change in the dimer and HMW oligomer levels. (C) The dependence of A2AR oligomerization on three consecutive charged residues 355ERR357. The substitution of residues 355ERR357 to 355AAA357 is referred to as the ERR:AAA mutations. The levels of dimer and HMW oligomer are expressed relative to the monomeric population as an arbitrary unit, with reported errors calculated from the variance of the fit, not experimental variation.
Figure 4.
Figure 4.. Non-bonded interactions of the extended C-terminus of A2AR play a critical role in stabilization of the dimeric interface.
(A) Dimer configurations from cluster analysis in GROMACS of the 394-residue variant identify two major clusters involving either (1) the C-terminus of one protomer and the C-terminus, ICL2, and ICL3 of the second protomer or (2) the C-terminus of one protomer and ICL2, ICL3, and ECL2 of the second protomer. Spheres: residues forming intermolecular electrostatic contacts. (B) Average number of residues that form electrostatic contacts as a function of sequence length of A2AR. (C) Average number of residues that form hydrogen bonds as a function of sequence length of A2AR. The criteria for designating inter-A2AR contacts as electrostatic interactions or hydrogen bonds are described in detail in Materials and methods.
Figure 5.
Figure 5.. The effects of ionic strength on the oligomerization of various A2AR variants reveal the involvement of depletion interactions.
The levels of (A) dimer and (B) high-molecular-weight oligomer + dimer are expressed relative to the monomeric population as an arbitrary unit and plotted against ionic strength, with reported errors calculated from the variance of the fit, not experimental variation. NaCl concentration is varied to achieve ionic strengths of 0.15, 0.45, and 0.95 M.
Figure 5—figure supplement 1.
Figure 5—figure supplement 1.. The dimer/oligomerization of A2AR is a thermodynamic process where the dimer and high-molecular-weight oligomer once formed are kinetically trapped.
(A) Size-exclusion chromatography (SEC) chromatograms of the consecutive rounds of SEC performed on A2AR-WT and Q372ΔC. The first rounds of SEC are to separate the dimer/oligomer population and the monomer population, while the second rounds of SEC are performed on these SEC-separated populations to assess their stability and reversibility. The total oligomer level is expressed relative to the monomeric population in arbitrary units. (B) Energy diagram depicting A2AR oligomerization progress. The monomer needs to overcome an activation barrier (EA), driven by depletion interactions, to form the dimer/oligomer. Once formed, the dimer/oligomer populations are kinetically trapped by disulfide linkages.
Figure 6.
Figure 6.. The A2AR C-terminus is prone to aggregation.
(A) Absorbance at 450 nm of the A2AR C-terminus in solution, with NaCl and GdnHCl concentrations varied to achieve ionic strengths 0–4 M. Inset: the solution at ionic strength 4 M achieved with NaCl. The Hofmeister series is provided to show the ability of cations to salt-out (blue) or salt-in (red) proteins. (B) SYPRO orange fluorescence of solutions containing the A2AR C-terminus as the temperature was varied from 20°C to 70°C (gray). The change in fluorescence, measured in relative fluorescence unit (RFU), was calculated by taking the first derivative of the fluorescence curve (black).
Figure 6—figure supplement 1.
Figure 6—figure supplement 1.. The C-terminus of A2AR can form non-polar contacts.
(A) Hydropathy plot against A2AR residue number showing the hydrophobicity of A2AR C-terminus, scored with ProtScale using method described by Kyte and Doolittle, window size of 3. Positive scores represent hydrophobicity and negative scores hydrophilicity. (B) The non-polar residues in A2AR C-terminus. (C) Average number of residues that form non-polar contacts as a function of sequence length of A2AR. The criteria for designating inter-A2AR contacts as non-polar interactions are described in detail in Materials and methods.
Figure 7.
Figure 7.. Visualizing A2AR dimeric interface and observing conformational changes of the TM7 using MD simulations.
(A) Representative snapshot of A2AR-C394ΔC dimers shows salt bridge formation between a sample trajectory. The insets are closeups of the salt bridges, which can be both intra- and intermolecular. The last inset shows a network of salt bridges with the charged cluster 355ERR357 involved. (B) Helical tilt angles for TM7 helix in A2AR as a function of protein length. Systematic truncations of the C-terminus lead to rearrangement of the heptahelical bundle. The participation of the C-terminus in A2AR dimerization increases the tilting of the TM7 domain, which is in closest proximity to the C-terminus.
Figure 7—figure supplement 1.
Figure 7—figure supplement 1.. Helical tilt angles for TM1–6 helices in A2AR as a function of protein length.
Systematic truncations of the C-terminus lead to rearrangement of the heptahelical bundle, propagated to the entire receptor and is especially pronounced in helices proximal to the C-terminus, that is, TM1, TM2, TM7. For almost all TM helices, a noticeable shift in tilt angle occurs upon modeling the full-length (394 residues) variant. This behavior is fundamentally different from the conventional model of G protein-coupled receptor (GPCR) activation, in which TM 1, 2, 4, and 7 remain rigid, with TM5 and TM6 undergoing an outward tilt/rotation to enable binding to the cognate G protein. Relaxation of the heptahelical bundle (i.e., an increase in helical tilt) as a function of protein length and dimerization could potentially be critical to our understanding of the activation mechanism of A2AR as past studies have overwhelmingly focused on activation of the monomer.
Author response image 1.
Author response image 1.. Decorrelation time calculated from representative trajectories of each A2AR truncated system.

Similar articles

Cited by

References

    1. Abraham MJ, Murtola T, Schulz R, Páll S, Smith JC, Hess B, Lindahl E. GROMACS: high performance molecular simulations through multi-level parallelism from laptops to supercomputers. SoftwareX. 2015;1-2:19–25. doi: 10.1016/j.softx.2015.06.001. - DOI
    1. Armando S, Quoyer J, Lukashova V, Maiga A, Percherancier Y, Heveker N, Pin JP, Prézeau L, Bouvier M. The chemokine CXC4 and CC2 receptors form Homo- and heterooligomers that can engage their signaling G-protein effectors and βarrestin. The FASEB Journal. 2014;28:4509–4523. doi: 10.1096/fj.13-242446. - DOI - PubMed
    1. Asakura S, Oosawa F. Interaction between particles suspended in solutions of macromolecules. Journal of Polymer Science. 1958;33:183–192. doi: 10.1002/pol.1958.1203312618. - DOI
    1. Bagher AM, Laprairie RB, Toguri JT, Kelly MEM, Denovan-Wright EM. Bidirectional allosteric interactions between cannabinoid receptor 1 (CB1) and dopamine receptor 2 long (D2L) heterotetramers. European Journal of Pharmacology. 2017;813:66–83. doi: 10.1016/j.ejphar.2017.07.034. - DOI - PubMed
    1. Baldwin RL. How Hofmeister ion interactions affect protein stability. Biophysical Journal. 1996;71:2056–2063. doi: 10.1016/S0006-3495(96)79404-3. - DOI - PMC - PubMed

Publication types