. 2021 Aug 5;184(16):4251-4267.e20.
doi: 10.1016/j.cell.2021.06.025. Epub 2021 Jul 13.

Meiotic recombination mirrors patterns of germline replication in mice and humans

Affiliations

Meiotic recombination mirrors patterns of germline replication in mice and humans

Florencia Pratto et al. Cell. .

Abstract

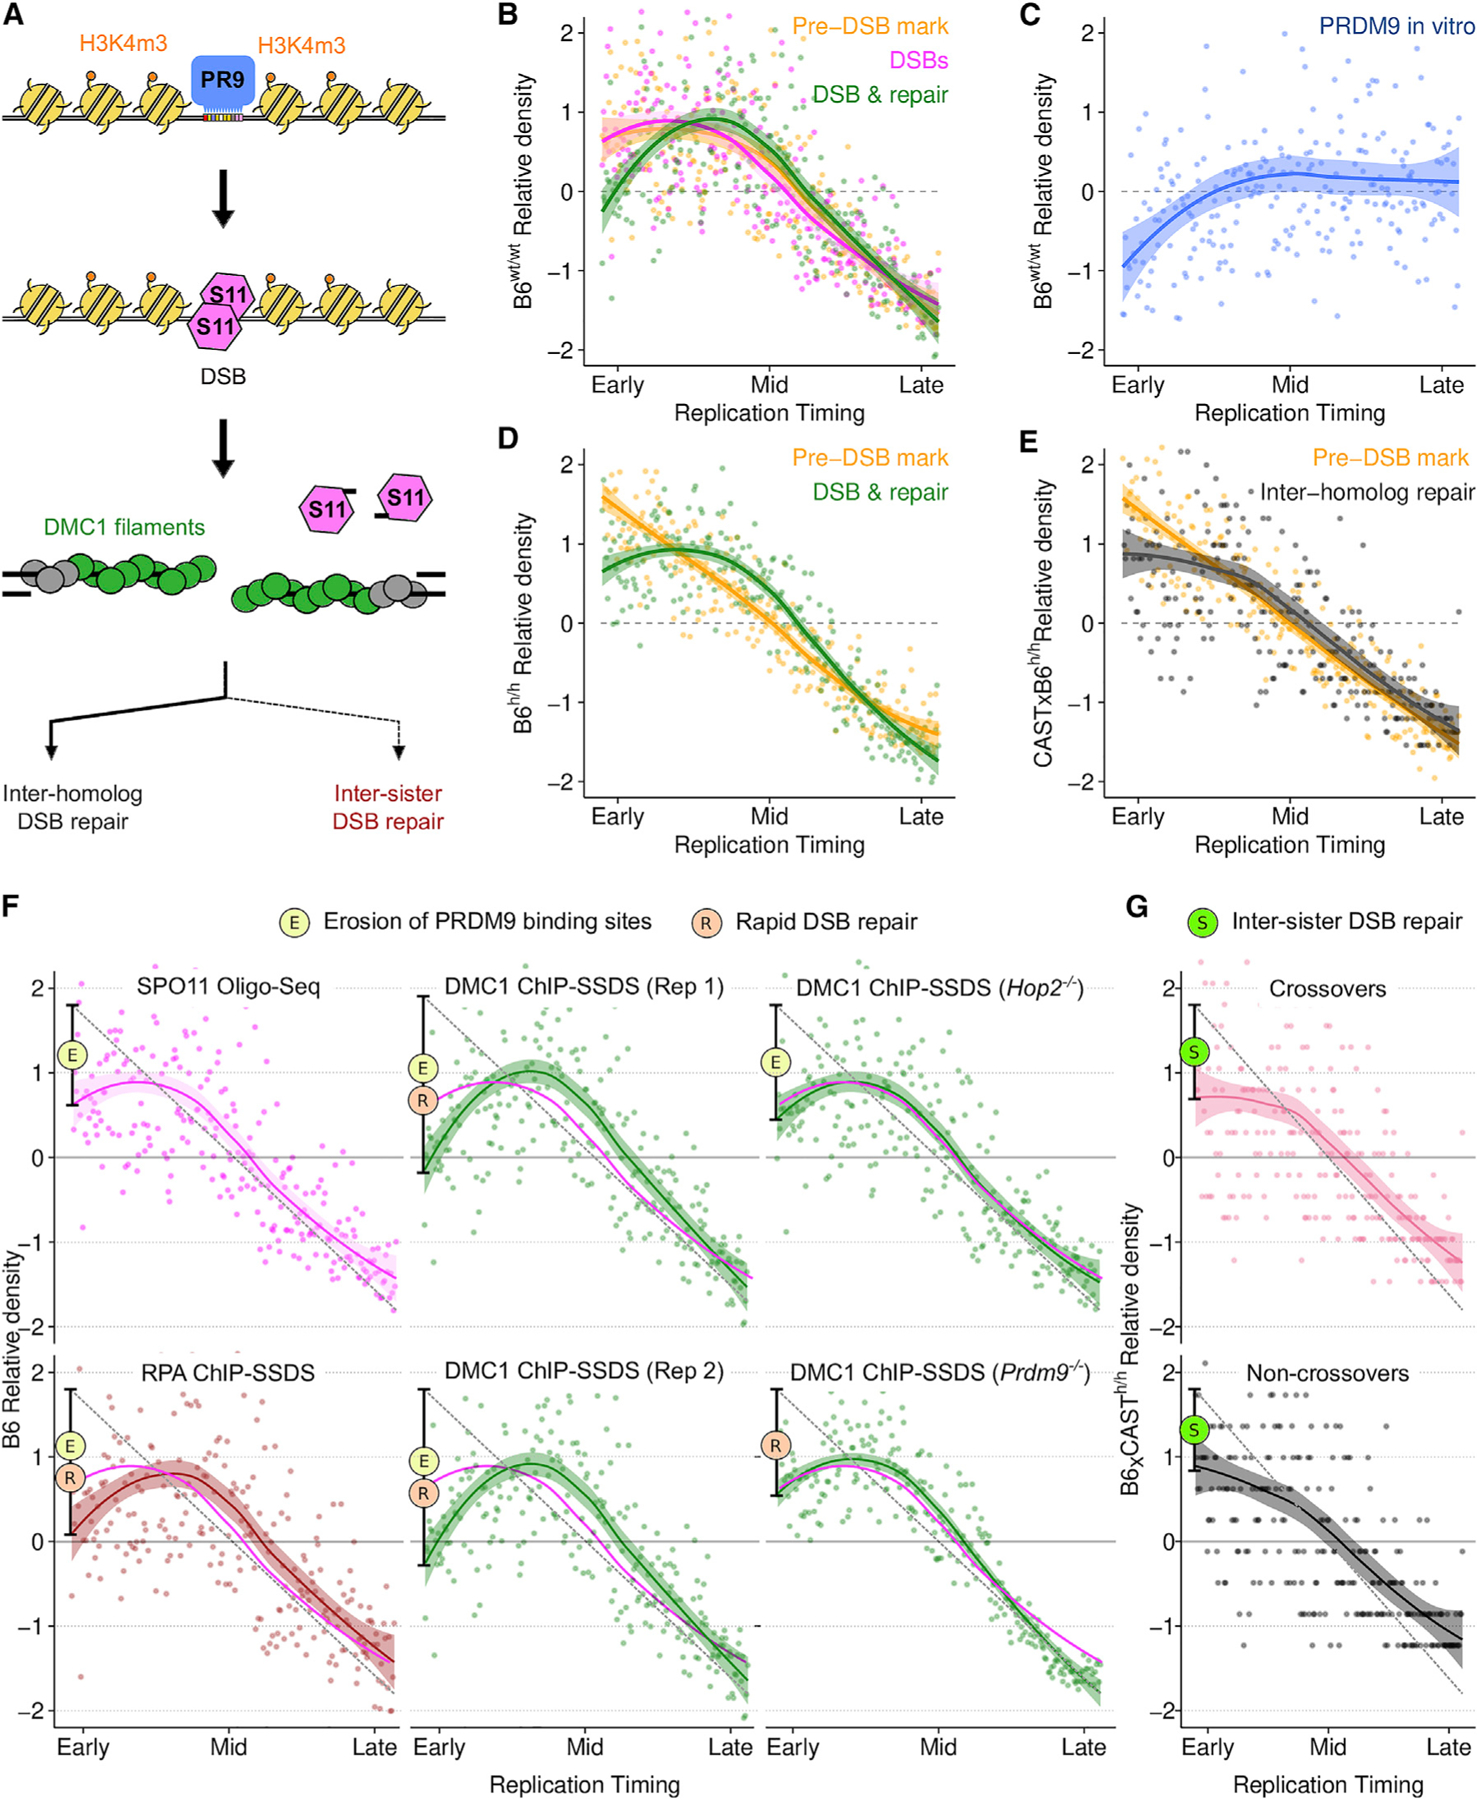
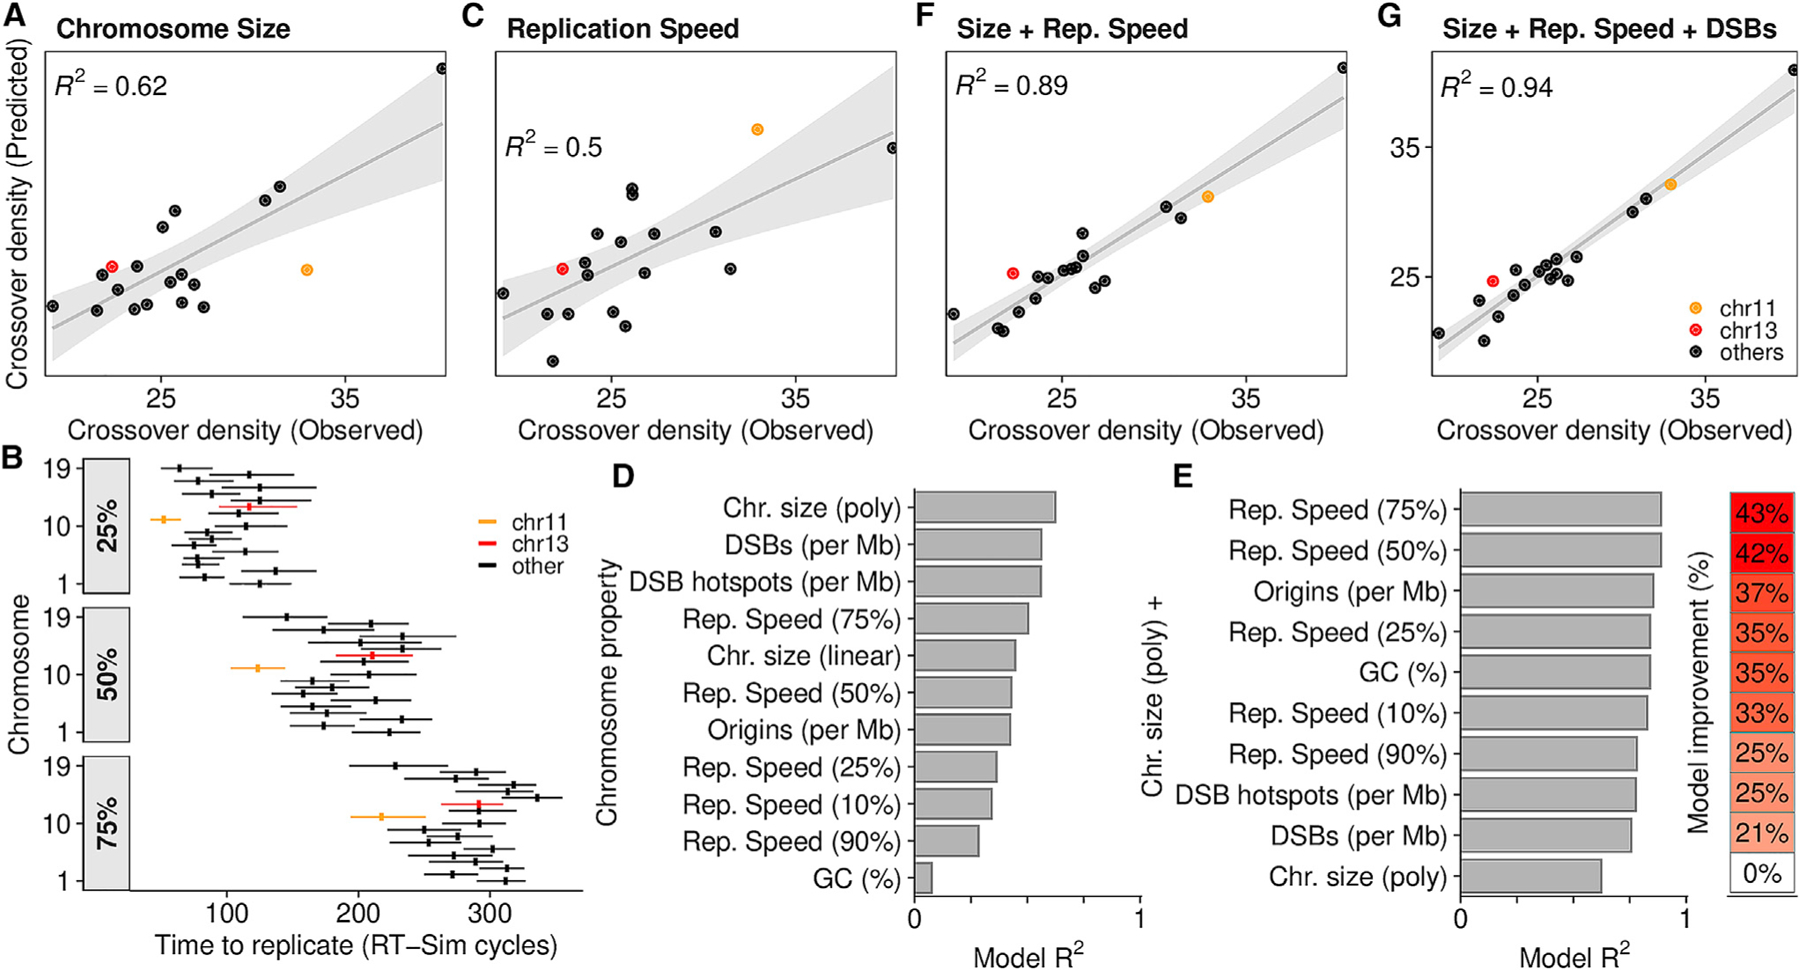
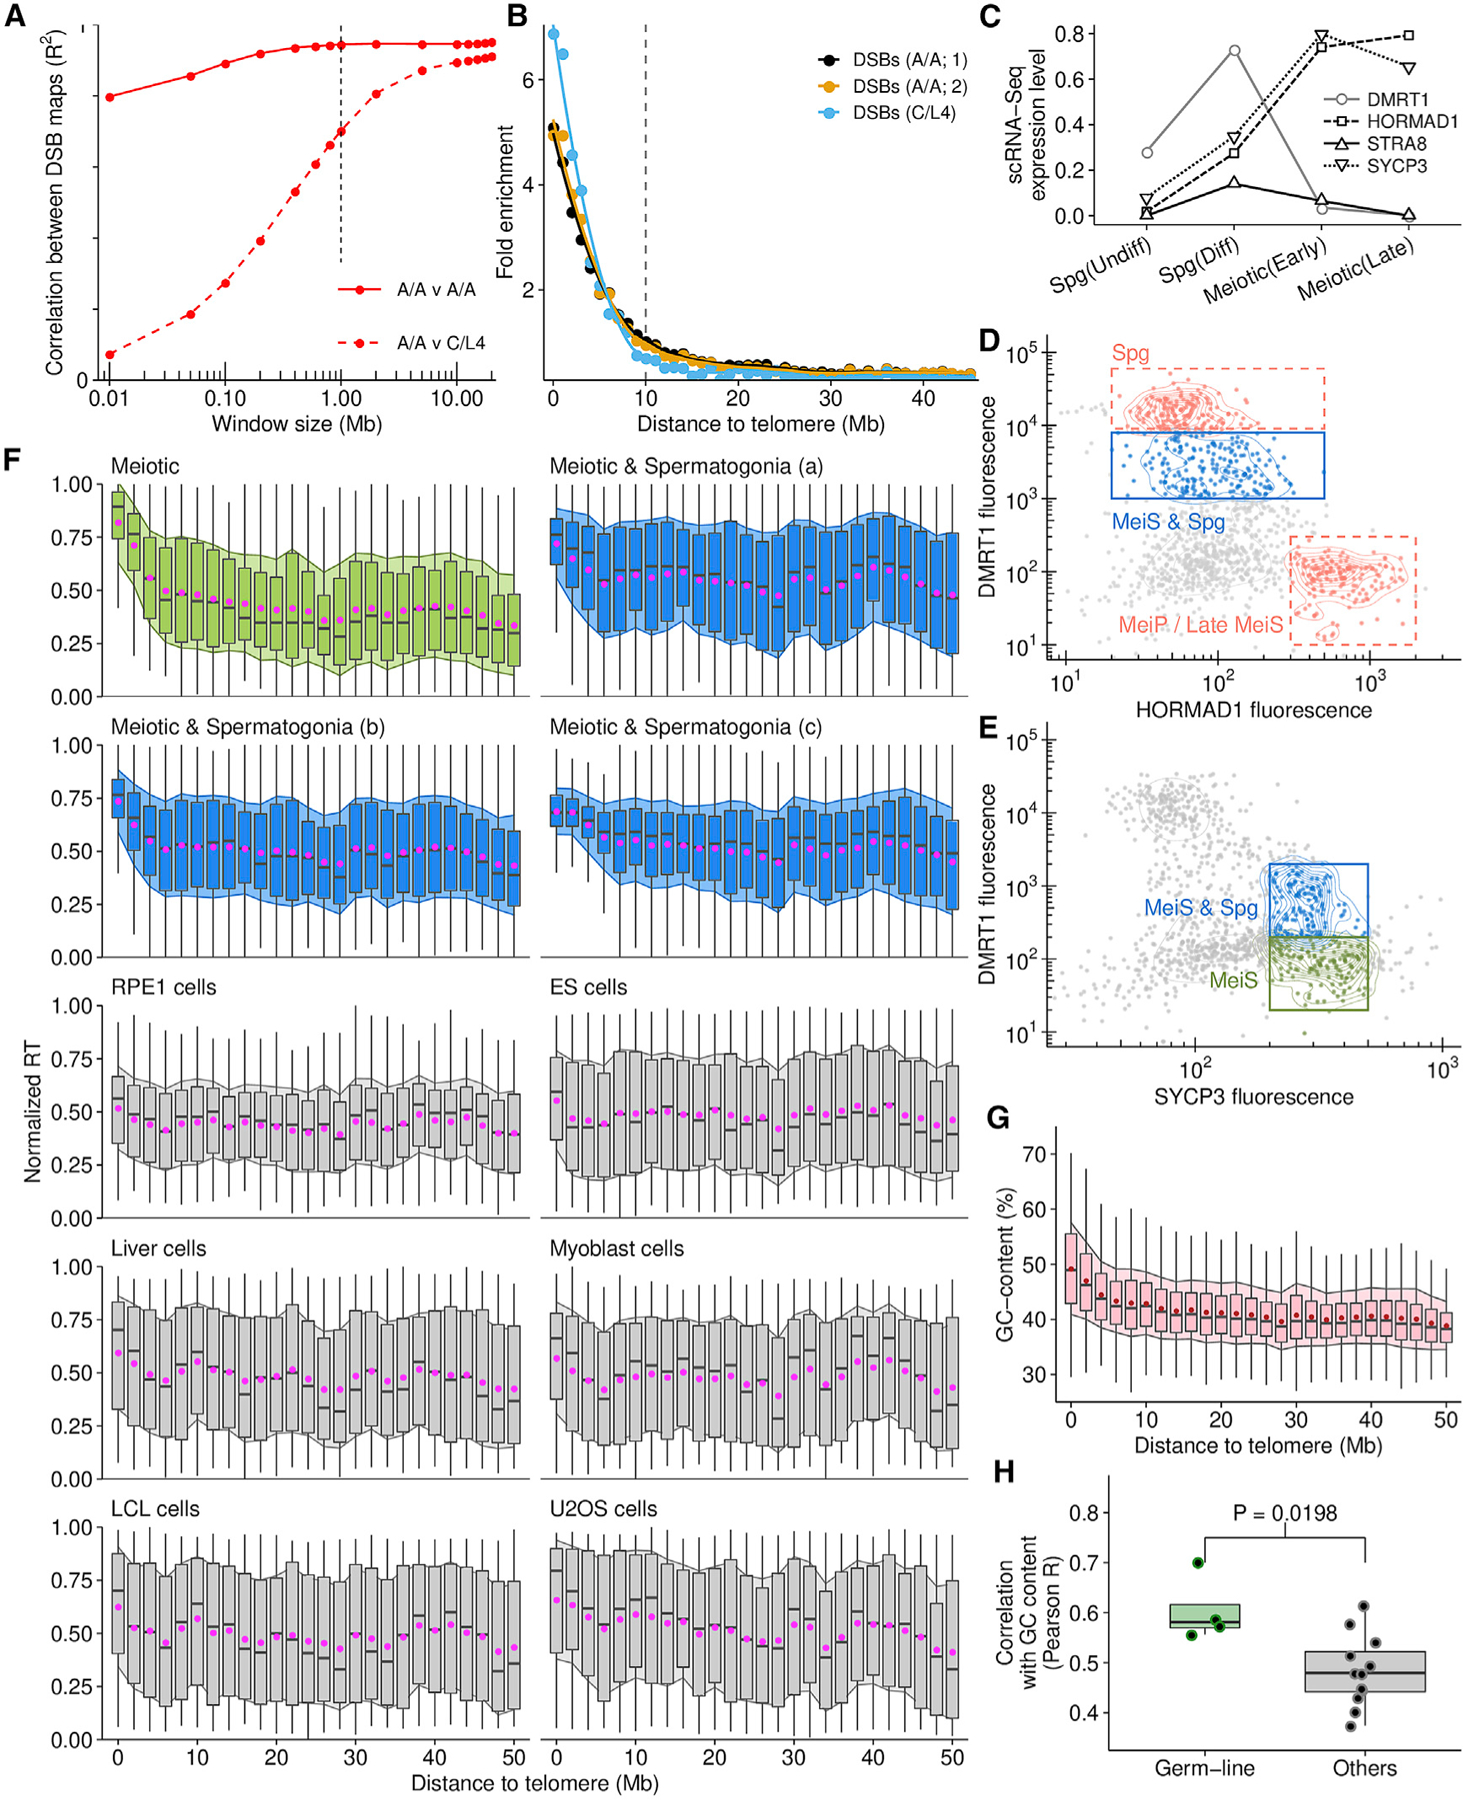
Genetic recombination generates novel trait combinations, and understanding how recombination is distributed across the genome is key to modern genetics. The PRDM9 protein defines recombination hotspots; however, megabase-scale recombination patterning is independent of PRDM9. The single round of DNA replication, which precedes recombination in meiosis, may establish these patterns; therefore, we devised an approach to study meiotic replication that includes robust and sensitive mapping of replication origins. We find that meiotic DNA replication is distinct; reduced origin firing slows replication in meiosis, and a distinctive replication pattern in human males underlies the subtelomeric increase in recombination. We detected a robust correlation between replication and both contemporary and historical recombination and found that replication origin density coupled with chromosome size determines the recombination potential of individual chromosomes. Our findings and methods have implications for understanding the mechanisms underlying DNA replication, genetic recombination, and the landscape of mammalian germline variation.

Keywords: DNA replication; chromosome structure; crossover; genome evolution; genome stability; germline; in silico modeling; meiosis; recombination.


Conflict of interest statement

Declaration of interests The authors declare no competing interests.

Figures

Figure 1.
Figure 1.. Identification of replication origins
(A) Schematic of the Ori-SSDS protocol to sequence nascent leading strands. (B) The Ori-SSDS signal in a typical 1 Mb region (black, total coverage; heatmap shows coverage by strand: red, Watson; blue, Crick; 1 kb windows, 147 bp step). Inset: zoom of a typical peak. (C) Characteristic, reproducible Watson-Crick asymmetry at origins is lost in controls. The log2 ratio of Watson/Crick ssDNA fragments is shown (1 kb smoothing). (D) Ori-SSDS peaks coincide with a switch in the direction of lagging-strand DNA synthesis (from Okazaki-fragment sequencing). (E) Origin efficiency is highly correlated among replicates. Origins found only in one replicate are colored purple and green, respectively. See also Figures S1 and S2 and Data S1.
Figure 2.
Figure 2.. Clustering of replication origins in the genome
(A) Stochastic replication initiation at Ori-SSDS peaks. (B) 6 SNS-seq origin calls coincide with a single Ori-SSDS peak (green box). Gray represents replicate SNS-seq coverage tracks (Cayrou et al., 2015). SNS-seq origin calls (IS) or initiation ‘‘zones’’ (IZ) are green. (C) The number of origins of replication from SNS-seq is reduced if peaks within 1 kb (clusters) are considered as single origins (human: Long et al. [2020], mouse: Cayrou et al. [2015]). (D) Cumulative width distribution of Ori-SSDS peaks. (E) Peaks of CpG density (see STAR Methods) coincide with Ori-SSDS peak centers. Origins <6 kb were considered. (F) CpG peaks within broad initiation zones (peaks >10 kb) exhibit Ori-SSDS Crick-Watson asymmetry. (G) CpG peak counts as a function of origin width. Most narrow origins contain 0 or 1 CpG peaks. (H and I) Examples of broad Ori-SSDS peaks. See also Figures S2 and S3 and Data S1.
Figure 3.
Figure 3.. Replication timing in meiotic prophase I of male mice
(A–C) Meiotic S-phase and spermatogonia nuclei were isolated using fluorescence-activated nuclei sorting (Lam et al., 2019). (A) Replicating nuclei were isolated (2–4C). (B) Isolation of S-phase nuclei (see STAR Methods). MeiS, meiotic; SpgU, undifferentiated spermatogonia; SpgI, intermediate spermatogonia; SpgB, type-B spermatogonia. (C) SYCP3 is elevated in meiotic nuclei. (D) Micrograph showing the purity of meiotic S-phase nuclei (403 magnification; insets 1003). Distinctive DAPI morphology is also used to assess purity (Bellvé et al., 1977). Blue arrow, Sertoli cell nucleus (DMRT1+, STRA8); orange arrow, unknown type (DMRT1, STRA8+). Letter code indicates nucleus-type (left panel: M, meiotic; S, Sertoli; U, unknown). (E) Replication timing (RT; log2 of normalized sequencing coverage) in meiotic S-phase correlates with Ori-SSDS peak locations in testis. (F) RT in ESCs. (G) RT is correlated across cell-types. RT was inferred from published data for spermatogonial stem cells (SSCs), primordial germ cells (PGCs), embryonic stem cells (ESCs), CD8+ cells (CD8s), and activated B cells (Bcells). Pre-processed RT data were obtained for myoblast and lymphoblastoid cell lines (LCLs). Details of samples in Tables S1, S2, and S3. (H) GC-content (1 Mb smoothing, 10 kb steps; log2(GC/median)) and genome compartmentalization at zygonema (Patel et al., 2019) correlate with RT. Hi-C track shows the eigenvector values for the first principal component of the Hi-C matrix (100 kb windows, 1 Mb smoothing, 10 kb steps; A, active; B, inactive Hi-C compartments). See also Figure S4 and Data S1.
Figure 4.
Figure 4.. In silico modeling recapitulates RT from origin locations
(A) Best fitting RT-sim model for meiotic S-phase RT (MeiS(a)). Heatmap shows RT in individual simulated haploid genomes. Lower panel compares experimentally determined RT (filled area) to simulated RT (black line). Both simulated and experimental RT are normalized by mean and SD ((RT — mean(RT))/SD(RT)). (B) Fit scores for models built using RT from different cell types and different datasets as a proxy for origins. Mean of the top 0.015% of models is shown. Sample details in Tables S1, S2, and S3. Briefly, RT is from: MeiS, meiotic S-phase; Spg(B,I,U), B-type, intermediate, and undifferentiated spermatogonia; ESCs, embryonic stem cells; SSCs, spermatogonial stem cells; PGCs, primordial germ cells; CD8, CD8 cells; myoblast, myoblast cell line; LCL, lymphoblastoid cell line; Bcells, activated B cells. (a,b,c) designate replicates. ESC(a) is from our ESC culture, ESC(b) is from published whole-genome sequencing data. Ori (hi-conf), high confidence Ori-SSDS peaks; Ori(r), randomized Ori-SSDS peaks; AS+CGI, ATAC-seq peak at a CGI; AS-CGI, ATAC-seq peak not at a CGI; CGI-AS, CGI not at an ATAC-seq peak. (C) Best fitting RT-Sim model for RT in ESC(a). (D) Isolation of S-phase nuclei with increasing DNA content (T1–T4). The optimal simulation run-time for best-fitting models correlates with increasing DNA content. Nonetheless, the predicted S-phase duration is similar among all populations. (E) S-phase duration estimates from RT-sim. (F) Replisome firing rate estimates from RT-sim. See also Figures S5, S6, and S7 and Data S1.
Figure 5.
Figure 5.. Rapid DSB repair and elevated meiotic recombination in early-replicating regions
(A) Schematic of meiotic recombination (colors in B–F reflect this schematic; PR9, PRDM9; S11, SPO11). (B and D) PRDM9-mediated H3K4m3 at DSB hotspots (yellow) is enriched in early replicating DNA in both wild-type B6 male mice (B6wt/wt) (B) and in mice with a humanized PRDM9 allele (B6h/h) (D). DSB formation (SPO11-oligo mapping; pink) follows this Pre-DSB mark (B). The DMC1-SSDS (green) signal decays relative to H3K4me3 in the earliest replicating DNA. (C) B6 PRDM9 binding sites are depleted in early replicating DNA (measured by Affinity-seq) in the B6wt/wt genome. (E) Inter-homolog repair products (crossovers + non-crossovers) (Li et al., 2019) are depleted in the earliest replicating DNA relative to DSB-associated H3K4m3 (H3K4m3 data as in D, plotted against B6xCAST RT). (F) The rate of DSB formation (magenta) is superimposed on all panels. RPA-SSDS signal is depleted in the earliest replicating DNA. Two replicates of DMC1-SSDS are shown (Rep 1 is also in B). Note that PRDM9 binding site erosion does not affect PRDM9-independent DSB hotspots. (G) Both crossovers (COs) and Non-crossovers (NCO) are depleted in the earliest replicating DNA. For all figures, dots represent the average signal from all autosomal bins for each RT quantile (N = 250). Simulated RT is from the T1 B6 meiocyte population (B–D and F) or from a B6xCAST F1 hybrid (E and G). RT patterns are very similar in B6 and B6xCAST. Solid lines depict a LOESS smoothed signal ± SE (shaded; span = 0.8). The dashed gray line is a projected linear correlation and the deviation from this is shown (black bar) (F and G). Phenomena contributing to each dip are indicated by colored circles. See also Data S1.
Figure 6.
Figure 6.. DNA replication predicts per-chromosome crossover rates
(A) A linear regression model can predict crossover density from chromosome size (polynomial fit). Crossover density = total crossovers per Mb. Data from Yin et al. (2019). R2 is skewed by a single outlier (chr19; top right). (B) Chromosomes replicate asynchronously. chr11 and chr13 are highlighted. Despite being a similar size, chr11 replicates earlier. The time required to replicate 25%/50%/75% of each chromosome is inferred from the best-fitting RT-sim model. Horizontal lines, interquartile range of times from individual models; vertical line, median. (C) Linear regression to predict crossover density from replication speed. (D) Individual properties of chromosomes can predict crossover density. The Pearson R2 of predicted versus observed crossover density for each model is shown. (E) Linear models using chromosome size in addition to other properties better predict crossover density. (F) Per chromosome crossover density is predicted by a linear model that combines replication speed (75%) and chromosome size. (G) Adding DSB frequency (DMC1-SSDS in B6xCAST F1 mice) (Smagulova et al., 2016) yields a slightly better model. See also Data S1.
Figure 7.
Figure 7.. Subtelomeric DNA replicates early in human male meiosis
(A) DSB density correlates at megabase-scale in human males with different PRDM9 genotypes (PRDM9A/A homozygotes [A/A] and PRDM9C/L4 [C/L4] heterozygote). (B) Points represent the average DMC1-SSDS signal in 1-Mb bins, normalized to interstitial regions (>30 Mb). (C) Stage-specific expression of meiotic markers (Guo et al., 2018). (D) Putative meiotic S-phase nuclei gated on DMRT1 and HORMAD1 (blue) contain spermatogonia (manual inspection). (E) A pure meiotic S-phase population (green) is isolated using DMRT1 and SYCP3. (F) Subtelomeric DNA replicates consistently early in meiotic (green, blue) but not in somatic cells (gray; Table S3). Boxplots depict the interquartile range of replication timing values in 2-Mb regions across the genome; gray bar, median; magenta dot, mean ± 1 SD (filled shadow). (G) GC content is elevated in subtelomeric DNA. (H) RT in the germline (all meiotic samples) correlates better with genomic GC content than RT in other cell types. See also Data S2.

Comment in

Similar articles

Cited by

References

    1. Almeida R, Fernández-Justel JM, Santa-María C, Cadoret J-C, Cano-Aroca L, Lombraña R, Herranz G, Agresti A, and Gómez M (2018). Chromatin conformation regulates the coordination between DNA replication and transcription. Nat. Commun 9, 1590. - PMC - PubMed
    1. Amemiya HM, Kundaje A, and Boyle AP (2019). The ENCODE Blacklist: Identification of Problematic Regions of the Genome. Sci. Rep 9, 9354. - PMC - PubMed
    1. Anderson EL, Baltus AE, Roepers-Gajadien HL, Hassold TJ, de Rooij DG, van Pelt AMM, and Page DC (2008). Stra8 and its inducer, retinoic acid, regulate meiotic initiation in both spermatogenesis and oogenesis in mice. Proc. Natl. Acad. Sci. USA 105, 14976–14980. - PMC - PubMed
    1. Baker CL, Walker M, Kajita S, Petkov PM, and Paigen K (2014). PRDM9 binding organizes hotspot nucleosomes and limits Holliday junction migration. Genome Res 24, 724–732. - PMC - PubMed
    1. Baudat F, Manova K, Yuen JP, Jasin M, and Keeney S (2000). Chromosome synapsis defects and sexually dimorphic meiotic progression in mice lacking Spo11. Mol. Cell 6, 989–998. - PubMed

Publication types