. 2021 Jul 13;118(28):e2100171118.
doi: 10.1073/pnas.2100171118. Epub 2021 Jul 6.

Proton-gated coincidence detection is a common feature of GPCR signaling

Affiliations

Proton-gated coincidence detection is a common feature of GPCR signaling

Nicholas J Kapolka et al. Proc Natl Acad Sci U S A. .

Abstract

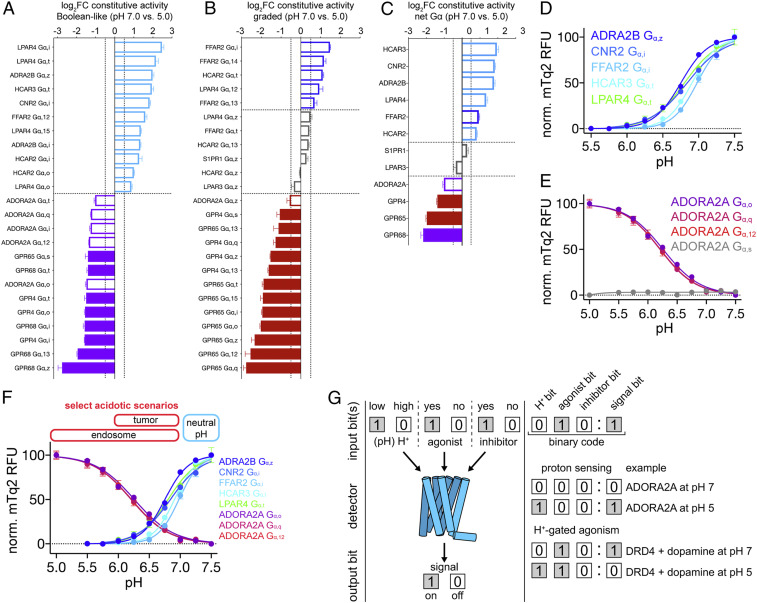
The evolutionary expansion of G protein-coupled receptors (GPCRs) has produced a rich diversity of transmembrane sensors for many physical and chemical signals. In humans alone, over 800 GPCRs detect stimuli such as light, hormones, and metabolites to guide cellular decision-making primarily using intracellular G protein signaling networks. This diversity is further enriched by GPCRs that function as molecular sensors capable of discerning multiple inputs to transduce cues encoded in complex, context-dependent signals. Here, we show that many GPCRs are coincidence detectors that couple proton (H+) binding to GPCR signaling. Using a panel of 28 receptors covering 280 individual GPCR-Gα coupling combinations, we show that H+ gating both positively and negatively modulates GPCR signaling. Notably, these observations extend to all modes of GPCR pharmacology including ligand efficacy, potency, and cooperativity. Additionally, we show that GPCR antagonism and constitutive activity are regulated by H+ gating and report the discovery of an acid sensor, the adenosine A2a receptor, which can be activated solely by acidic pH. Together, these findings establish a paradigm for GPCR signaling, biology, and pharmacology applicable to acidified microenvironments such as endosomes, synapses, tumors, and ischemic vasculature.

Keywords: Boolean; GPCR; acidosis; coincidence detection; proton gating.


Conflict of interest statement

Competing interest statement: N.J.K., J.B.R., G.J.T., W.M.M., and D.G.I. have filed a patent application with the US Patent and Trademark Office related to this work.

Figures

Fig. 1.
Fig. 1.
Using yeast to study H+-gated coincidence detection by human GPCRs. Confocal images, wavelength ratios, and pHi values reported by the pH biosensor pHluorin in human embryonic kidney (HEK293) (A) and yeast cells (S. cerevisiae strain BY4741) (B) 10 min after pH treatment. Error bars represent SD of n = 8 biological replicates. (Scale bars, 5 μm.) pHluorin calibration experiments are provided in SI Appendix, Fig. S1. (C) The native yeast GPCR, Ste2, and its downstream pathway components are not affected by changes in pHe. Error bars represent SD of n = 4 experimental replicates. (D and E) Schematic summary of the DCyFIR platform. (D) In the DCyFIR platform, a human GPCR is coupled to a MAP kinase signaling cascade via a human/yeast C-terminal Gα chimera in which the last five residues of the native yeast Gα subunit, Gpa1, are replaced with the last five residues of a human Gα (pink helix). Upon activation, signaling by the genome-integrated human GPCR is quantified by the expression of a genome-integrated fluorescent transcriptional reporter mTurquoise2. (E) The DCyFIR platform covers all possible Gα coupling combinations for a given GPCR using 10 independent C-terminal Gα chimera strains (referred to as GPCR-Gα strains). Further details regarding the DCyFIR model can be found in Yeast DCyFIR Strains and Human Cell Lines.
Fig. 2.
Fig. 2.
H+-gated coincidence detection for 131 GPCR-Gα coupling combinations. Waterfall plots showing H+-gated agonist responses that exhibited Boolean-like (A) and graded (B) signaling behaviors between pH 7 and 5. For Boolean-like responses (A), differential agonism was quantified as the log2 fold change (log2FC) of the ratio of agonist-treated and untreated GPCR-Gα strains that signaled at high (cyan) or low (purple) pH. For graded responses (B), differential agonism was quantified as the log2FC of agonist responses between pH 7 and 5. GPCR-Gα strains that signaled more at pH 7, more at pH 5, or similarly at pH 7 and 5 are colored blue, red, and gray, respectively. Further details on the calculation of log2FC are available in Materials and Methods. (C) Waterfall plot showing the net Gα agonist responses for a given receptor using the ratio of summed activity for all agonist-active GPCR-Gα strains between pH 7 and 5. The color schemes used in A and B, and their associated classifications, are also used in C. (D) Boolean-like signaling behavior exhibited by dopamine receptor 4 (DRD4 Gα,i). (E) pH-insensitive GPCR signaling by melatonin receptor 1A (MTNR1A Gα,i). (AC) Vertical dashed lines correspond to a log2FC of 0.5, and horizontal dashed lines separate examples that signaled more (log2FC ≥ 0.5) at pH 7 (blue/cyan bars) similarly (log2FC between ± 0.5) between both pH values (gray bars) or more (log2FC ≤ 0.5) at pH 5 (red/purple bars). Primary DCyFIR profiling data for A and B is provided in SI Appendix, Fig. S2. (AE) Error bars represent SD of n = 4 experimental replicates. Further details regarding calculation of log2FC, experimental replicates, and experimental error are available in DCyFIR Profiling.
Fig. 3.
Fig. 3.
Representative pH titrations of H+-gated coincidence detection by GPCRs that exhibit Boolean-like and graded signaling behaviors. Select examples of Boolean-like and graded signaling behaviors by human GPCRs are shown. Titrations are the product of n = 4 independent experimental replicates with error bars representing the SD of each data point. Further details regarding the experimental setup, data processing, and experimental replicates are available in pH Titrations.
Fig. 4.
Fig. 4.
Pharmacological modalities of H+-gated coincidence detection by GPCRs. (A) Potentiation of agonist potency. Endpoint measurements of ADRA2B agonism (Left) at pH 7 (gray bars) and 5 (white bars). Epinephrine dose–response curves (Middle) and pEC50 values (Right) for ADRA2B. (BD) Potentiation of agonist efficacy. Endpoint measurements (Left) of ADRA2A (B), HTR4 (C), and HCAR2 (D) agonism at pH 7 (gray bars) and 5 (white bars). Dose–response curves (Middle) and efficacy (Right) of each GPCR with its endogenous agonist. (E) Potentiation of sensitivity. 2-arachidonoylglycerol (2-AG) (Top), JWH-018 (Middle), and HU-210 (Bottom) dose–response curves (Left) and Hill coefficients (Right) for CNR2. (F) Potentiation of inhibition/antagonism. Caffeine (Top), ZM-241385 (Middle), and SCH-58261 (Bottom) dose–response curves (Left) and percent inhibition (Right) for ADORA2A in the presence of 10 μM adenosine. (AF) Error bars represent SD of n = 4 experimental replicates. Statistical significance was calculated using a two-tailed Student’s t test (AD) or Kruskal–Wallis followed by Dunnett’s multiple comparison test (E and F), ****P < 0.0001. Further details regarding the experimental setup, data processing, and experimental replicates are available in DCyFIR Profiling and pH Titrations.
Fig. 5.
Fig. 5.
New proton sensors and potential implications of Boolean-like H+-gated GPCR signaling. (A and B) Waterfall plots showing H+-gated GPCR-Gα constitutive activity that exhibited Boolean-like (A) and graded (B) signaling behaviors between pH 7 and 5. Differential signaling was quantified as the log2FC between pH 7 and 5. (C) Waterfall plot showing the net Gα responses for a given receptor using the ratio of summed mTq2 RFU for all constitutively active GPCR-Gα strains between pH 7 and 5, with Boolean-like responders colored cyan and purple, respectively. (D and E) New proton-sensing GPCRs inactivated (D) and activated (E) by low pH. (F) pH titrations of new proton-sensing GPCRs in the context of pH changes associated with select physiological processes and pathologies. (G) An illustration conceptualizing how H+-gated coincidence detection by Boolean-like responders (e.g., ADORA2A and DRD4) could lead to switch-like logic in GPCR signaling networks. (AC) Vertical dashed lines correspond to a log2FC of 0.5, and horizontal dashed lines separate examples that signaled more (log2FC ≥ 0.5) at pH 7 (blue/cyan bars) similarly (log2FC between ± 0.5) between both pH values (gray bars) or more (log2FC ≤ 0.5) at pH 5 (red/purple bars). Filled bars correspond to strains of the known acid sensors (GPR4, GPR65, and GPR68). (AF) Error bars represent SD of n = 4 experimental replicates. Further details regarding the calculation of log2FC, experimental replicates, and experimental error are available in DCyFIR Profiling and pH Titrations.

Similar articles

Cited by

References

    1. Strotmann R., et al. ., Evolution of GPCR: Change and continuity. Mol. Cell. Endocrinol. 331, 170–178 (2011). - PubMed
    1. Ludwig M. G., et al. ., Proton-sensing G-protein-coupled receptors. Nature 425, 93–98 (2003). - PubMed
    1. Wang J. Q., et al. ., TDAG8 is a proton-sensing and psychosine-sensitive G-protein-coupled receptor. J. Biol. Chem. 279, 45626–45633 (2004). - PubMed
    1. Carlton J. G., Cullen P. J., Coincidence detection in phosphoinositide signaling. Trends Cell Biol. 15, 540–547 (2005). - PMC - PubMed
    1. Miyashita T., et al. ., Mg(2+) block of Drosophila NMDA receptors is required for long-term memory formation and CREB-dependent gene expression. Neuron 74, 887–898 (2012). - PMC - PubMed

Publication types

LinkOut - more resources