. 2021 Sep 6;218(9):e20201916.
doi: 10.1084/jem.20201916. Epub 2021 Jul 14.

Engrailed 1 coordinates cytoskeletal reorganization to induce myofibroblast differentiation

Affiliations

Engrailed 1 coordinates cytoskeletal reorganization to induce myofibroblast differentiation

Andrea-Hermina Györfi et al. J Exp Med. .

Abstract

Transforming growth factor-β (TGFβ) is a key mediator of fibroblast activation in fibrotic diseases, including systemic sclerosis. Here we show that Engrailed 1 (EN1) is reexpressed in multiple fibroblast subpopulations in the skin of SSc patients. We characterize EN1 as a molecular amplifier of TGFβ signaling in myofibroblast differentiation: TGFβ induces EN1 expression in a SMAD3-dependent manner, and in turn, EN1 mediates the profibrotic effects of TGFβ. RNA sequencing demonstrates that EN1 induces a profibrotic gene expression profile functionally related to cytoskeleton organization and ROCK activation. EN1 regulates gene expression by modulating the activity of SP1 and other SP transcription factors, as confirmed by ChIP-seq experiments for EN1 and SP1. Functional experiments confirm the coordinating role of EN1 on ROCK activity and the reorganization of cytoskeleton during myofibroblast differentiation, in both standard fibroblast culture systems and in vitro skin models. Consistently, mice with fibroblast-specific knockout of En1 demonstrate impaired fibroblast-to-myofibroblast transition and are partially protected from experimental skin fibrosis.


Conflict of interest statement

Disclosures: C. Bergmann reported personal fees from Boehringer Ingelheim and Pfizer during the conduct of the study. O. Distler reported personal fees from Abbvie, Acceleron Pharma, Amgen, AnaMar, Arxx Therapeutics, Baecon Discovery, Blade Therapeutics, Bayer, Böhringer Ingelheim, ChemomAb, Corbus Pharmacheuticals, CSL Behring, Galapagos NV, Glenmark Pharmaceuticals, GSK, Horizon Pharmaceuticals, Inventiva, Iqvia, Italfarmaco, Iqone, Kymera Therapeutics, Lupin Pharmaceuticals, Medac, Medscape, Mitsubishi Tanabe Pharma, MSD, Novartis, Pfizer, Roche, Roivant, Sanofi, Serodapharm, Topadur, Target Bioscience, and UCB during the conduct of the study; in addition, O. Distler had a patent to mir-29 for the treatment of systemic sclerosis issued (US8247389, EP2331143). J.H.W. Distler reported personal fees from Janssen, Anamar, ARXX, Bayer Pharma, Boehringer Ingelheim, Galapagos, GSK, Inventiva, Novartis, and UCB; grants from Anamar, ARXX, aTyr, Bayer Pharma, Boehringer Ingelheim, Cantargia, Celgene, CSL Behring, Galapagos, Inventiva, Kiniksa, and UCB outside the submitted work; and owns stock in 4D Science. No other disclosures were reported.

Figures
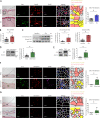
Figure 1.
Figure 1.
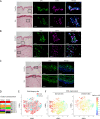
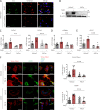
EN1 expression is up-regulated in fibrotic skin. (A) Representative immunofluorescence stainings for EN1 (green) and costainings with P4H (red) and CD45 (magenta) in the dermis of healthy donors and SSc patients at 1,000-fold magnification (scale bars = 20 µm). Hematoxylin and eosin stainings (200-fold magnification, scale bars = 100 µm), Voronoi diagrams, and percentages of EN1-positive fibroblasts from all fibroblasts (defined as P4H+CD45 cells) are included. Data are shown from one experiment (n ≥ 4). (B and C) EN1 mRNA (B) and EN1 intracellular or secreted protein levels (C) in cultured fibroblasts or their supernatants from healthy donors and SSc patients. Representative Western blot images and quantifications are included (C). Data are shown from one experiment (n = 3). (D and E) En1 protein levels in the skin of mice challenged with bleomycin (D) or Tsk-1 mice (E) and their respective controls. Representative Western blot images and quantifications are included. Data are compiled from two independent experiments (n ≥ 4). (F and G) Representative immunofluorescence stainings for EN1 (green) and costainings with Vimentin (red) and CD45 (magenta) in the dermis of mice challenged with bleomycin and their controls at 1,000-fold magnification (F; scale bars = 20 µm) and in the hypodermis of Tsk-1 mice and their controls, respectively, at 1,000-fold magnification (G; scale bars = 20 µm). Hematoxylin and eosin stainings (100-fold magnification, scale bars = 200 µm [F] and 40-fold magnification, scale bars = 500 µm [G]), Voronoi diagrams, and percentages of EN1-positive fibroblasts from all fibroblasts (defined as Vimentin+CD45 cells) are included. Data are shown from one experiment each (n ≥ 3). All data are represented as median ± interquartile range. P values are expressed as follows: *, 0.05 > P > 0.01 (Mann-Whitney U test).
Figure S1.
Figure S1.
EN1 expression in healthy and SSc skin. (A–C) Representative immunofluorescence stainings for EN1 (green) and costainings with CD31 (A) and CD45 (B; both magenta) in the dermis of healthy donors and SSc patients at 1,000-fold magnification (scale bars = 20 µm). Hematoxylin and eosin stainings (200-fold magnification, scale bars = 100 µm) are included. Data for A–C were obtained from n ≥ 4 biological samples from two independent experiments. (D) Composition of clusters from the segmented IMC images in ventral and dorsal skin biopsies from SSc patients. (E) tSNE plot showing distribution of cells from ventral and dorsal SSc skin across clusters. (F) tSNE plot showing expression of EN1 across the ventral and dorsal SSc clusters. Data for D–F were obtained from n = 8 biological samples from four SSc patients (paired ventral and dorsal biopsies).
Figure 2.
Figure 2.
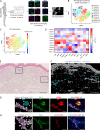
EN1 is expressed in multiple fibroblast subpopulations in the skin of SSc patients. (A) Schematic representation of the experimental and analytical workflow. IMC was performed on paired skin biopsies from ventral and dorsal skin from four SSc patients stained with a panel consisting of 22 metal-labeled antibodies. Segmentation of the multiplexed images comprising the signals from all markers into masks representing single cells was performed. (B) Phenograph clustering and visualization on a tSNE map of CD45 E-Cadherin cells from all patients, regardless of biopsy location. (C) Expression of EN1 (as log[normalized intensity]) across the clusters. (D) Heatmap of marker expression across the clusters (as Z-score). (E and F) Representative hematoxylin and eosin staining (E) and schematic representation of clusters 6 and 7 (as the clusters with the highest expression of EN1, >1 SD above the mean; F), illustrating the spatial relationships of cells belonging to these clusters (scale bars = 200 µm). (G and H) Visualization of the area of interest marked in F, with EN1 signals (green) and αSMA (G) or CD31 and von Willebrand factor (H; red) as the markers with the highest expression from the clusters 6 and 7 (scale bars = 50 µm). Data were obtained from n = 8 biological samples from 4 SSc patients (paired ventral and dorsal biopsies) from one experiment.
Figure 3.
Figure 3.
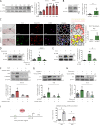
TGFβ up-regulates EN1 in a SMAD3-dependent manner. (A) EN1 protein levels in cultured human fibroblasts at 1, 3, 6, 24, and 48 h after TGFβ stimulation. Representative Western blot images and quantification are included. Data are compiled from two experiments (n ≥ 4). (B) En1 protein levels in the skin of mice expressing TBRICA and their controls. Representative Western blot images and quantifications are included. Data are compiled from two experiments (n ≥ 4). (C) Representative immunofluorescence stainings for En1 (green) and costainings with Vimentin (red) and CD45 (magenta) in the dermis of mice expressing TBRICA and their controls at 1,000-fold magnification (scale bars = 20 µm). Data are shown from one experiment (n ≥ 4). Hematoxylin and eosin stainings (100-fold magnification, scale bars = 200 µm), Voronoi diagrams, and percentages of EN1-positive fibroblasts from all fibroblasts (defined as Vimentin+CD45 cells) are included. (D and E) En1 protein levels in the skin of mice challenged with bleomycin (D) or Tsk-1 mice (E) and/or treated with the TBRI inhibitor SD-208 and their respective controls. Representative Western blot images and quantifications are included. Data are compiled from two experiments (n ≥ 4). (F) EN1 protein levels in cultured human fibroblasts with siRNA-mediated SMAD3 knockdown with or without stimulation with TGFβ (24 h) and their controls (fibroblasts transfected with nontargeting siRNA). Representative Western blot images and quantification are included. Data are compiled from two experiments (n = 4). (G and H) En1 protein levels in the skin of TBRICA mice (or, as controls, mice injected with an adenovirus expressing LacZ; G) or of mice challenged with bleomycin (or, as controls, mice injected with NaCl; H) and/or treated with SMAD3 siRNA and their controls (mice injected with nontargeting siRNA). Representative Western blot images and quantifications are included. Data are compiled from two experiments (n = 5). (I) ChIP PCR for SMAD3 binding at predicted SMAD3 motifs in the promoter of EN1. Data are compiled from two experiments (n = 4). All data are represented as median ± interquartile range. P values are expressed as follows: *, 0.05 > P > 0.01; **, 0.01 > P > 0.001; ***, P < 0.001 (Mann–Whitney U test for B and C; ANOVA with Tukey’s post hoc test for A and D–I).
Figure 4.
Figure 4.
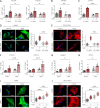
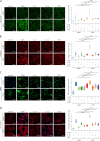
EN1 promotes fibroblast activation and collagen production. (A–E) siRNA-mediated knockdown of EN1 prevents TGFβ-induced fibroblast activation. Relative mRNA levels of COL1A1 and COL1A2 (A). Relative protein levels of secreted collagen type I (B). Relative mRNA levels of ACTA2 (C). Representative immunofluorescence stainings for αSMA (D) and stress fibers (E) at 400-fold magnification (scale bars = 50 µm). Quantification of average signal intensity for each cell (relative to control) is included. Data for A–E were obtained from n ≥ 4 independent biological samples per group from two independent experiments. (F–J) EN1 overexpression promotes fibroblast activation. Relative mRNA levels of COL1A1 and COL1A2 (F). Relative protein levels of secreted collagen type I (G). Relative mRNA levels of ACTA2 (H). Data for F–J were obtained from n ≥ 4 independent biological samples per group from two independent experiments. Representative immunofluorescence stainings for αSMA (I) and stress fibers (J) at 400-fold magnification (scale bars = 50 µm). Quantification of average signal intensity for each cell (relative to control) is included. All data are represented as median ± interquartile range. P values are expressed as follows: *, 0.05 > P > 0.01; **, 0.01 > P > 0.001; ***, P < 0.001 (ANOVA with Tukey’s post hoc test).
Figure S2.
Figure S2.
Knockout of En1 ameliorates TGFβ-induced fibroblast activation. (A) Representative immunofluorescence stainings for En1 (green) and costaining with Vimentin (red) in the dermis of mice with fibroblast-specific knockout of En1 and controls, both groups challenged with bleomycin, at 1,000-fold magnification (scale bars = 20 µm). Data were obtained from one experiment (n = 4). (B) En1 protein levels (representative Western blot images). Data were obtained from one experiment (n = 3). (C) Relative mRNA levels of Col1a1 and Col1a2. (D) Secreted collagen 1 protein levels. (E) Relative mRNA levels of Acta2. Data for C–E were compiled from two independent experiments (n ≥ 4). (F) Representative immunofluorescence stainings for αSMA (green) and stress fibers (red) at 400-fold magnification (scale bars = 50 µm). Quantification of signal intensity relative to control is included. Data for F were obtained from two independent experiments (n ≥ 4). All data are represented as median ± interquartile range. P values are expressed as follows: **, 0.01 > P > 0.001; ***, P < 0.001 (ANOVA with Tukey’s post hoc test).
Figure S3.
Figure S3.
EN1 overexpression promotes IL-11–, IL-13–, and CTGF-induced fibroblast activation and ECM deposition to a lesser extent than TGFβ-induced fibroblast activation and ECM deposition.(A and B) Representative immunofluorescence stainings for fibronectin (A) and collagen type I (B) at 100-fold magnification (scale bars = 200 µm). Quantification of average signal intensity (relative to control) is included. (C and D) Representative immunofluorescence stainings for αSMA (C) and stress fibers (D) at 200-fold magnification (scale bars = 100 µm). Quantification of average signal intensity for each cell line (relative to control) is included. All data are represented as median ± interquartile range of n ≥ 3 independent biological samples per group from at least two independent experiments. P values are expressed as follows: *, 0.05 > P > 0.01; **, 0.01 > P > 0.001; ***, P < 0.001 (ANOVA with Tukey’s post hoc test). Data for A–D were obtained from two independent experiments (n = 4).
Figure 5.
Figure 5.
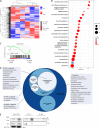
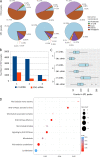
EN1 induces a profibrotic gene expression profile. (A–C) RNA-seq results showing that knockdown of EN1 partially reverses the profibrotic gene expression profile induced by TGFβ, without affecting apoptosis. Heatmap of expression levels of the 632 EN1-DEGs across the three replicates for each condition. Hierarchical clustering of the replicates and of the EN1-DEGs’ expression are included (A). Dot plot showing gene ratio (on the x axis), gene count (as dot size), and adjusted P value (as color gradient) of selected enriched GO and Reactome terms (after g:Profiler enrichment analysis) related to fibrosis (B). GSEA of the apoptosis Reactome term (C). Data for A–C were obtained from n = 3 independent biological samples per group. (D) Circular packing plots illustrating enrichment of fibrosis-related GO and Reactome terms (after g:Profiler enrichment analysis) of the EN1-DEGs with predicted binding motifs for SP1/2/3/8 (SP) and cobinding with other members of the C2H2 or E2F families, or with NFYB (expressed as percentages from the total fibrosis-related processes enriched in EN1-DEGs). The threshold for DEGs was false discovery rate < 0.25 and fold-change >1.5, and the conditions were as follows: nontargeting siRNA treated human fibroblasts stimulated with TGFβ as reference group and EN1 siRNA treated human fibroblasts stimulated with TGFβ as treatment group. (E) Coimmunoprecipitation of EN1 with SP1 in human fibroblasts ± TGFβ (24 h). Representative Western blot images are included. Data were obtained from two independent experiments (n = 3).
Figure S4.
Figure S4.
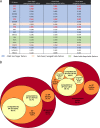
EN1 promotes formation of SP1/2/3/8-containing regulatory modules with specialized profibrotic function.(A) Transcription factors with enriched binding motifs in the promoters of up- and down-regulated EN1-DEGs, with gene ratio in EN1-DEGs (ratio of genes that contain motifs for the respective transcription factor) more than twofold higher than the gene ratio in negative controls, colored by families. (B) Circular packing plots illustrating predicted SP1/2/3/8 (SP) binding in the promoters of up- and down-regulated EN1-DEGs and cobinding with other members of the C2H2 or E2F families and with NFYB or TFDP1, expressed as percentages.
Figure 6.
Figure 6.
Direct genomic targets of EN1 and SP1. (A) Genomic localization of EN1 and SP1 peaks showing enrichment of EN1 peaks in intergenic and intronic regions, while SP1 peaks show great enrichment in promoter regions defined as 300–3,000 bp upstream from transcription start site. (B and C) Knockdown of EN1 reduces the number and activity of SP1 peaks across all three biological replicates. Number of SP1 peaks (B). Read counts in SP1 peaks (C). (D) Dot plot showing gene ratio (on the x axis), gene count (as dot size), and adjusted P value (as color gradient) of selected enriched GO and Reactome terms after g:Profiler enrichment analysis of the EN1-DEGs with direct SP1 binding related to fibrosis. Data were obtained from n = 3 independent biological samples per group.
Figure 7.
Figure 7.
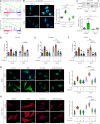
EN1 overexpression promotes microtubule depolymerization to induce myofibroblast differentiation. (A) GSEA of the indicated GO terms, showing that EN1 knockdown de-enriches genes related to microtubule depolymerization and actin nucleation. (B and C) EN1 overexpression induces microtubule depolymerization. Representative immunofluorescence stainings for α-Tubulin at 400-fold magnification (scale bars = 50 µm). Quantification of total signal intensity for each cell (relative to control) is included (B). Protein levels of soluble and insoluble α-Tubulin. Representative Western blot images and quantification of insoluble/soluble α-Tubulin ratio are included (C). Data for B and C were obtained from two independent experiments (n ≥ 4). (D–H) Pharmacological stabilization of microtubules prevents EN1-induced myofibroblast differentiation. Relative mRNA levels of COL1A1 (D). Relative protein levels of secreted collagen type I (E). Relative mRNA levels of ACTA2 (F). Representative immunofluorescence stainings for αSMA (G) and stress fibers (H) at 400-fold magnification (scale bars = 50 µm). Quantification of average signal intensity for each cell (relative to control) is included. Data for D–H were obtained from two independent experiments (n ≥ 4). All data are represented as median ± interquartile range. P values are expressed as follows: *, 0.05 > P > 0.01; **, 0.01 > P > 0.001; ***, P < 0.001 (ANOVA with Tukey’s post hoc test).
Figure S5.
Figure S5.
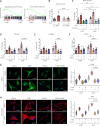
Knockdown of EN1 stabilizes the microtubular network to inhibit stress fiber formation and myofibroblast differentiation.(A and B) Knockdown of EN1 stabilizes microtubules. Representative immunofluorescence stainings for α-Tubulin at 400-fold magnification (scale bars = 50 µm). Quantification of total signal intensity for each cell (relative to control) is included (A). Protein levels of soluble and insoluble α-Tubulin. Representative Western blot images and quantification of insoluble/soluble α-Tubulin ratio are included (B). Data for A and B were obtained from two independent experiments (n ≥ 4). (C–G) Pharmacological depolymerization of microtubules abrogates the inhibitory effects of EN1 knockdown on TGFβ-induced myofibroblast differentiation. Relative mRNA levels of COL1A1 (C). Relative protein levels of secreted collagen type I (D). Relative mRNA levels of ACTA2 (E). Representative immunofluorescence stainings for αSMA (F) and stress fibers (G) at 400-fold magnification (scale bars = 50 µm). Data for C–G were obtained from two independent experiments (n ≥ 4). Quantification of average signal intensity for each cell (relative to control) is included. All data are represented as median ± interquartile range. P values are expressed as follows: *, 0.05 > P > 0.01; **, 0.01 > P > 0.001; ***, P < 0.001 (ANOVA with Tukey’s post hoc test).
Figure 8.
Figure 8.
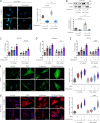
EN1 induces ROCK activity to coordinate microtubule-actin cytoskeletal rearrangements and myofibroblast differentiation.(A) GSEA of the indicated Reactome terms, showing that EN1 knockdown de-enriches genes related to signaling by Rho GTPases and Rho GTPases effectors. (B and C) EN1 induces ROCK activity by depolymerizing microtubules. ROCK activity after EN1 knockdown (B). ROCK activity after EN1 overexpression with/without microtubule stabilization (C). Data for B and C were obtained from two independent experiments (n ≥ 4). (D–H) Pharmacological inhibition of ROCK activity prevents EN1-induced myofibroblast differentiation. Relative mRNA levels of COL1A1 (D). Relative protein levels of secreted collagen type I (E). Relative mRNA levels of ACTA2 (F). Representative immunofluorescence stainings for αSMA (G) and stress fibers (H) at 400-fold magnification (scale bars = 50 µm). Quantification of average signal intensity for each cell (relative to control) is included. Data for D–H were obtained from two independent experiments (n ≥ 4). All data are represented as median ± interquartile range. P values are expressed as follows: *, 0.05 > P > 0.01; **, 0.01 > P > 0.001; ***, P < 0.001 (ANOVA with Tukey’s post hoc test).
Figure 9.
Figure 9.
EN1 promotes TGFβ-induced fibrotic transformation of 3D skin equivalents in a microtubule- and ROCK-dependent manner.(A–E) Pharmacological stabilization of microtubules or inhibition of ROCK activity prevents EN1-mediated fibrotic transformation of 3D skin equivalents. Relative mRNA levels of COL1A1 (A) and ACTA2 (B). Representative trichrome stainings of skin models, acquired with a slide scanner at 40× magnification; adjacent pictures of the same slide were stitched to generate overview pictures; white bars indicate dermal thickness (scale bars = 200 µm; C). Quantification of dermal thickness (D) and of myofibroblast counts (E). All data are represented as median ± interquartile range of n = 6 independent biological samples per group from two independent experiments. P values are expressed as follows: ***, P < 0.001 (ANOVA with Tukey’s post hoc test).
Figure 10.
Figure 10.
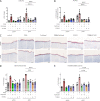
Fibroblast-specific knockout of En1 ameliorates experimental skin fibrosis. (A–D) TBRICA mice with fibroblast-specific knockout of En1 are protected from skin fibrosis. Representative trichrome stainings of the skin shown at 100× magnification (scale bars = 200 µm; A). Quantification of dermal thickness (B), myofibroblast counts (C), and hydroxyproline content (D), with figure legend under the plots. (E–H) Bleomycin-challenged mice with fibroblast-specific knockout of En1 are protected from skin fibrosis. Representative trichrome stainings of the skin shown at 100× magnification (scale bars = 200 µm; E). Quantification of dermal thickness (F), myofibroblast counts (G), and hydroxyproline content (H), with figure legend under the plots. (I–L) Tsk-1 mice with fibroblast-specific knockout of En1 are protected from skin fibrosis. Representative trichrome stainings of the skin shown at 40× magnification (I). Quantification of dermal thickness (J), myofibroblast counts (K), and hydroxyproline content (L), with figure legend under the plots (scale bars = 500 µm). All data for A–L are represented as median ± interquartile range of n ≥ 5 independent biological samples per group from at least two independent experiments. P values are expressed as follows: *, 0.05 > P > 0.01; ***, P < 0.001 (ANOVA with Tukey’s post hoc test).

Similar articles

Cited by

References

    1. Aguilar-Hidalgo, D., Domínguez-Cejudo M.A., Amore G., Brockmann A., Lemos M.C., Córdoba A., and Casares F.. 2013. A Hh-driven gene network controls specification, pattern and size of the Drosophila simple eyes. Development. 140:82–92. 10.1242/dev.082172 - DOI - PubMed
    1. Akhmetshina, A., Palumbo K., Dees C., Bergmann C., Venalis P., Zerr P., Horn A., Kireva T., Beyer C., Zwerina J., et al. . 2012. Activation of canonical Wnt signalling is required for TGF-β-mediated fibrosis. Nat. Commun. 3:735. 10.1038/ncomms1734 - DOI - PMC - PubMed
    1. Alexandre, C., and Vincent J.P.. 2003. Requirements for transcriptional repression and activation by Engrailed in Drosophila embryos. Development. 130:729–739. 10.1242/dev.00286 - DOI - PubMed
    1. Armaka, M., Apostolaki M., Jacques P., Kontoyiannis D.L., Elewaut D., and Kollias G.. 2008. Mesenchymal cell targeting by TNF as a common pathogenic principle in chronic inflammatory joint and intestinal diseases. J. Exp. Med. 205:331–337. 10.1084/jem.20070906 - DOI - PMC - PubMed
    1. Beltran, A.S., Graves L.M., and Blancafort P.. 2014. Novel role of Engrailed 1 as a prosurvival transcription factor in basal-like breast cancer and engineering of interference peptides block its oncogenic function. Oncogene. 33:4767–4777. 10.1038/onc.2013.422 - DOI - PMC - PubMed

Publication types

MeSH terms