. 2021 Jul 13;12(1):4267.
doi: 10.1038/s41467-021-24548-0.

Sphingolipids mediate polar sorting of PIN2 through phosphoinositide consumption at the trans-Golgi network

Affiliations

Sphingolipids mediate polar sorting of PIN2 through phosphoinositide consumption at the trans-Golgi network

Yoko Ito et al. Nat Commun. .

Abstract

The lipid composition of organelles acts as a landmark to define membrane identity and specify subcellular function. Phosphoinositides are anionic lipids acting in protein sorting and trafficking at the trans-Golgi network (TGN). In animal cells, sphingolipids control the turnover of phosphoinositides through lipid exchange mechanisms at endoplasmic reticulum/TGN contact sites. In this study, we discover a mechanism for how sphingolipids mediate phosphoinositide homeostasis at the TGN in plant cells. Using multiple approaches, we show that a reduction of the acyl-chain length of sphingolipids results in an increased level of phosphatidylinositol-4-phosphate (PtdIns(4)P or PI4P) at the TGN but not of other lipids usually coupled to PI4P during exchange mechanisms. We show that sphingolipids mediate Phospholipase C (PLC)-driven consumption of PI4P at the TGN rather than local PI4P synthesis and that this mechanism is involved in the polar sorting of the auxin efflux carrier PIN2 at the TGN. Together, our data identify a mode of action of sphingolipids in lipid interplay at the TGN during protein sorting.


Conflict of interest statement

The authors declare no competing interests.

Figures
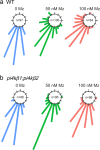
Fig. 1
Fig. 1. Metazachlor-induced root gravitropism defects are dependent upon PI4P synthesis at TGN.
Root gravitropism assay of wild-type (a) and pi4kβ1;pi4kβ2 double mutant (b), untreated (0 Mz) or treated with 50 nM metazachlor (Mz) or 100 nM Mz. After gravistimulation, root angles are calculated, distributed in 30° angle classes and plotted in circular charts where each bars correspond to the effective of roots in each classes of angles, from 0° (bottom of the chart) to 180° (top of the chart). Thus, the direction of the bars indicates the direction of growth after gravistimulation. The pi4kβ1;pi4k β2 double mutant is more insensitive to Mz treatment than wild-type. n values are indicated in the graphs.
Fig. 2
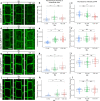
Fig. 2. Very long chain fatty acids are required for the intracellular distribution of PI4P.
Confocal micrographs of Arabidopsis root epidermal cells expressing either the PI4P biosensor mCIT-1×PHFAPP1 (a), mCIT-1×PHFAPP1-E50A (d), mCIT-2×PHFAPP1 (g), mCIT-3×PHFAPP1 (j) upon 0, 50, or 100 nM Mz (Mz) treatment. Fluorescence intensity at intracellular dots (b, e, h, k) and at PM (c, f, i, l) was quantified. All the PI4P biosensors tested showed significant increase of the signal intensity at intracellular dots upon metazachlor (Mz) treatment while only mCIT-1×PHFAPP1 showed a decrease of the signal at PM (al). (b, c) n = 63 cells from 21 roots (0 nM Mz) and 60 cells from 20 roots (50 and 100 nM). e, f n = 72 cells from 24 roots for each treatment. h, i n = 66 cells from 22 roots (0 and 100 nM), 63 cells from 21 roots (50 nM). k, l n = 63 cells from 21 roots (0 and 100 nM), 66 cells from 22 roots (50 nM). Statistics were done by two-sided Dwass-Steel-Critchlow-Flinger multiple comparison test with Monte Carlo method (10,000 iterations), *P < 0.01, ***P < 0.0001. Each element of the boxplot indicates the following value: center line, median; box limits, the first and third quartiles; whiskers, 1.5× interquartile range; points above or below the whiskers, outliers. Scale bars, 10 µm.
Fig. 3
Fig. 3. Composition of phosphoinositol monophosphate and fatty acids at TGN.
a Immuno-purification of intact TGN compartments. Step-gradient-purified membrane fraction was incubated with magnetic beads conjugated with CFP/GFP antibodies, and the intact compartments labeled by the SVs/TGN marker SYP61-CFP were immuno-purified. b, c LC-MS/MS analysis of phosphoinositol monophosphates (PIPs) in immuno-purified SYP61-SVs/TGN fraction in control condition (white) or treated with 100 nM metazachlor (Mz) (red) (n = 5 biological replicates, the dots show the dispersion of data, AU Arbitrary Unit (area of peak compound/area of internal standard)). b Mz increases the total amount of PIPs. c Detailed analysis shows that all species of PIPs are increased upon Mz. d, e GC-MS analysis of fatty acid and sterol composition of immuno-purified SYP61-SVs/TGN fraction in control condition (white) or treated with 100 nM Mz (red) (n = 3 biological replicates, the dots show the dispersion of data). d While Mz strongly decreased the sum of C24 and the sum of C26 fatty acids it did not affect the sterol content of SVs/TGN. e Detailed analysis shows that both non-α-hydroxylated 24:0, 24:1, 26:0 and α-hydroxylated h24:0, h24:1, h26:0 are reduced at TGN upon Mz. f In untreated control TGN, h24, and h26 (specific of sphingolipids) are two-fold enriched as compared to non-α-hydroxylated 24 and 26 fatty acids (present in both sphingolipids and PS).
Fig. 4
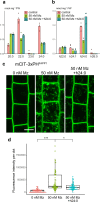
Fig. 4. α-hydroxylated h24:0 rescues the metazachlor-induced PI4P distribution defect at TGN.
a, b GC-MS analysis of Arabidopsis roots in control condition (pink), metazaclor (Mz)-treated roots (green), and metazachlor-treated roots implemented with h24:0 (blue) (n = 4 biological replicates, the dots show the dispersion of data). a Quantification of non-α-hydroxylated fatty acids and b α-hydroxylated fatty acids. External application of h24:0 in Mz-treated seedlings restores the level of h24:0 of control seedlings. c Confocal micrographs of Arabidopsis root epidermal cells expressing the PI4P biosensor mCIT-3xPHFAPP1 upon 0, 50 nM Mz treatment or 50 nM Mz treatment + h24:0 add-back. Scale bar, 10 µm. d Quantification of the fluorescence intensity at intracellular dots. While Mz treatment induces PI4P accumulation in intracellular dots, external application of h24:0 rescues this defect. n = 75 cells from 25 roots for each condition. Statistics were done by two-sided Dwass-Steel-Critchlow-Flinger multiple comparison test with Monte Carlo method (10000 iterations). *P < 0.01, ***P < 0.0001. Each element of the boxplot indicates the following value: center line, median; box limits, the first and third quartiles; whiskers, 1.5× interquartile range; points above or below the whiskers, outliers.
Fig. 5
Fig. 5. PS does not impact PI4P distribution at TGN.
a Confocal micrographs of Arabidopsis root epidermal cells expressing the PS biosensor mCIT-C2LACT upon 0 or 100 nM metazachlor (Mz) treatment. Fluorescence intensity at intracellular dots (b) and at PM (c) was quantified. The distribution of the PS biosensor was not altered upon Mz treatment (ac). n = 69 cells from 23 roots (0 nM), 75 cells from 25 roots (100 nM). d Confocal micrographs of Arabidopsis root epidermal cells expressing the PI4P biosensor mCIT-2×PHFAPP1 in wild-type/heterozygote plants or pss1-3 homozygote mutant. e Fluorescence intensity at intracellular dots was quantified. PI4P quantity at intracellular dots was not modified in pss1-3 mutant. n = 66 cells from 22 roots (WT/hetero), 63 cells from 21 roots (pss1-3). Statistics were done by two-sided Wilcoxson’s rank-sum test. Each element of the boxplot indicates the following value: center line, median; box limits, the first and third quartiles; whiskers, 1.5× interquartile range; points above or below the whiskers, outliers. Scale bars, 10 µm.
Fig. 6
Fig. 6. Sphingolipidomics of IPCS1;2amiRNA line and FB1-treated Arabidopsis roots.
a Simplified outline of sphingolipid biosynthesis pathway in plants. KCSs enzymes are part of the elongase complex that elongates fatty acids of 2 carbons per cycle to produce VLCFAs-CoA. Metazachlor inhibits KCS2, 20 and 9. VLCFAs-CoA is condensed with a long chain base (LCB) by the ceramide synthases LOH1 and LOH3 to produce VLCFAs-ceramide. FB1 inhibits LOH1 and LOH3. Ceramide is the substrate of the glucosylceramide synthase1 (GCS1) enzyme that grafts a glucose on ceramide to produce glucosylceramide (GluCer). Alternatively, ceramide is the substrate of the inositolphosphorylceramide (IPC) synthases (IPCSs) enzymes that graft a inositolphosphate (IP) group on ceramide to produce IPC. IPC is further glycosylated by addition of a glucuronic acid (GlcA) and mannose or to a minor extend N-acetylglucosamine (GlcNAc) residues to produce glycosylinositolphosphorylceramides (GIPCs) of series A, the most abundant form of sphingolipids in Arabidopsis. bd Sphingolipidomics of Arabidopsis roots, these analyses are displayed in details in supplementary Fig. 5 (n = 3 biological replicates, the dots show the dispersion of data, AU: Arbitrary Unit (area of peak compound/area of internal standard per mg fresh weight)). b The total quantity of ceramides increases in the IPCS1;2amiRNA line induced by β-estradiol (E2) while it is not altered upon FB1 treatment. c, d The total quantity of GIPC (c) or GluCer (d) decreases in the IPCS1;2amiRNA line induced by β-estradiol (E2) while it increases upon FB1 treatment.
Fig. 7
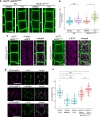
Fig. 7. IPCS enzymes are involved in PI4P distribution at SVs subdomain of TGN where they localize.
a Confocal micrographs of Arabidopsis root epidermal cells expressing the PI4P biosensor mCIT-3×PHFAPP1 in wild-type seedlings or IPCS1;2amiRNA line in control condition (DMSO) or treated with the β-estradiol inducer (E2). b Fluorescence intensity at intracellular dots was quantified. The IPCS1;2amiRNA line induced by β-estradiol accumulates PI4P in intracellular dots. n = 81 cells from 27 roots (WT + DMSO, WT + E2), 75 cells from 25 roots (IPCS1;2amiRNA + DMSO), 84 cells from 28 roots (IPCS1;2amiRNA + E2). c Colocalization between PI4P biosensors mCIT-2×PHFAPP1 or mCIT-3×PHFAPP1 and the SVs/TGN marker VHA-a1-mRFP or ECHIDNA protein, respectively, in the IPCS1;2amiRNA line induced by β-estradiol. d Colocalization between IPCS2-tagRFP and the SVs/TGN marker ECHIDNA, the CCVs/TGN marker CHC, or the Golgi marker MEMBRIN11. e Colocalization quantification of c and d. IPCS2 strongly co-localizes with SVs/TGN and more weakly with CCVs/TGN or the Golgi. PI4P biosensors strongly co-localize with SVs/TGN in the IPCS1;2amiRNA line, to a similar level as the colocalization of IPCS2 with SVs/TGN. n = 30 roots (IPCS2 + ECH, IPCS2 + MEMB11, IPCS2 + CHC), 58 cells from 20 roots (2×PHFAPP1 + VHA-a1), 60 cells from 20 roots (3×PHFAPP1 + ECH). Statistics were done by two-sided Wilcoxson’s rank-sum test (b) or two-sided Dwass-Steel-Critchlow-Flinger multiple comparison test with Monte Carlo method (10,000 iterations) (e), *P < 0.01, ***P < 0.0001. Each element of the boxplot indicates the following value: center line, median; box limits, the first and third quartiles; whiskers, 1.5× interquartile range; points above or below the whiskers, outliers. Scale bars, 10 µm.
Fig. 8
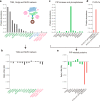
Fig. 8. LC-MS/MS label-free proteomics identified PI-PLCs as potential target of VLCFAs at TGN.
a, c, d, e Protein abundance in SYP61-SVs/TGN immuno-purified compartments analyzed by label-free quantitative proteomics (detailed analysis is displayed in Supplementary Data 3 and synthesized in Supplementary Data 4, including the number of peptides found for each proteins). a TGN (green), Golgi (blue), and MVB (red) markers, c PIP kinases and phosphatases, d PI-PLCs. The abundance ratio of the proteins shown in a or c, d between control and Mz-treated samples is displayed in b or e, respectively. For the calculation of ratio, we applied a threshold of minimal protein amount as 300,000 to select the proteins from which we can get reliable ratio. TGN markers were abundant compared to Golgi and MVB markers, which indicates an efficient purification, and their abundance was not affected by metazachlor (Mz) treatment. In contrast, PI-PLCs were strongly reduced upon Mz treatment. n = 4 biological replicates.
Fig. 9
Fig. 9. PI-PLC activity mediates the effect of acyl-chain length of sphingolipids on PI4P at the TGN.
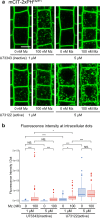
a Confocal images of root epidermal cells expressing the mCIT-2×PHFAPP1 PI4P biosensor treated with either the PI-PLC-inhibitor U73122 or its inactive analog U73343 at 1 or 5 µM on seedlings grown on 0 or 100 nM metazachlor (Mz)-containing medium. Scale bar, 10 µm. b Quantification of the fluorescence intensity at intracellular dots. The PI4P pool at dots was increased upon active U73122 treatment but not with inactive U73343, and this effect was enhanced by increasing the U73122 concentration from 1 to 5 µM. Treatment with 1 μM active U73122 on seedlings grown on 100 nM Mz increased PI4P pool at intracellular dots but not with 5 µM active U73122 indicating that Mz effect is mediated by PI-PLCs. n = 66 cells from 22 roots (0 nM Mz + 1 μM U73343, 100 nM Mz + 5 μM U73343, 100 nM Mz + 1 μM U73122, 0 nM Mz + 5 μM U73122), 63 cells from 21 roots (100 nM Mz + 1 μM U73343, 0 nM Mz + 1 μM U73122, 100 nM Mz + 5 μM U73122), 60 cells from 20 roots (0 nM Mz + 5 μM U73343). Statistics were done by two-sided Dwass-Steel-Critchlow-Flinger multiple comparison test with Monte Carlo method (10,000 iterations). *P < 0.01, *** P < 0.0001. Each element of the boxplot indicates the following value: center line, median; box limits, the first and third quartiles; whiskers, 1.5× interquartile range; points above or below the whiskers, outliers.
Fig. 10
Fig. 10. SL-mediated modulation of PI4P through PI-PLC impacts PIN2 sorting at SVs/TGN.
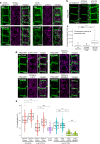
a Colocalization between PI4P biosensors mCIT-2×PHFAPP1 or mCIT-3×PHFAPP1 and the SVs/TGN marker VHA-a1-mRFP or ECHIDNA protein, respectively. Seedlings were either grown on 100 nM metazachlor (Mz) (upper panels) or treated with 5 μM PI-PLC-inhibitor U73122 (lower panels). In both cases (Mz or U73122 treatment), the PI4P-positive intracellular dots showed strong colocalization with TGN. b Confocal images of root epidermal cells expressing PIN2-GFP upon control condition (left), with 5 μM inactive analog of PI-PLC inhibitor (U73343, middle), and 5 μM active PI-PLC inhibitor (U73122, right). c Quantification of the fluorescence intensity of PIN2-GFP specifically at intracellular dots showed that PIN2 was accumulated at endomembrane compartments upon U73122 treatment. n = 69 cells from 23 roots (no treatment), 63 cells from 21 roots (U73343), 66 cells from 22 roots (U73122). d Colocalization of endomembrane compartments labeled by PIN2-GFP upon 5 μM U73122 treatment with either SVs/TGN labeled by SYP61-CFP (upper left), SVs/TGN labeled by mCherry-VTI12 (lower left), Golgi apparatus labeled by mCherry-SYP32 (upper right), or Golgi apparatus labeled by mCherry-MEMB12 (lower left). e Colocalization quantification of a and d. PIN2 showed significantly higher colocalization with SVs/TGN markers compared to the Golgi markers. n = 60 cells from 20 roots (2×PHFAPP1 × VHA-a1 + Mz, 3×PHFAPP1 × ECH + Mz, PIN2 × VTI12 + U73122), 59 cells from 20 roots (3×PHFAPP1 × ECH + U73122), 69 cells from 24 roots (2×PHFAPP1 × VHA-a1 + U73122), 60 cells from 21 roots (PLC2 × VHA-a1), 57 cells from 22 roots (PIN2 × SYP61 + U73122), 66 cells from 23 roots (PIN2 × SYP32 + U73122), 55 cells from 21 roots (PIN2 × MEMB12 + U73122). Statistics were done by two-sided Dwass-Steel-Critchlow-Flinger multiple comparison test with Monte Carlo method (10000 iterations), *P < 0.01, ***P < 0.0001. Each element of the boxplot indicates the following value: center line, median; box limits, the first and third quartiles; whiskers, 1.5× interquartile range; points above or below the whiskers, outliers. Scale bars, 10 μm.

Similar articles

Cited by

References

    1. Luschnig C, Vert G. The dynamics of plant plasma membrane proteins: PINs and beyond. Development. 2014;141:2924–2938. doi: 10.1242/dev.103424. - DOI - PubMed
    1. Di Martino R, Sticco L, Luini A. Regulation of cargo export and sorting at the trans‐Golgi network. FEBS Lett. 2019;593:2306–2318. doi: 10.1002/1873-3468.13572. - DOI - PubMed
    1. Gendre D, Jonsson K, Boutté Y, Bhalerao RP. Journey to the cell surface—the central role of the trans-Golgi network in plants. Protoplasma. 2015;252:385–398. doi: 10.1007/s00709-014-0693-1. - DOI - PubMed
    1. Noack LC, Jaillais Y. Precision targeting by phosphoinositides: how PIs direct endomembrane trafficking in plants. Curr. Opin. Plant Biol. 2017;40:22–33. doi: 10.1016/j.pbi.2017.06.017. - DOI - PubMed
    1. Capasso S, et al. Sphingolipid metabolic flow controls phosphoinositide turnover at the trans‐Golgi network. EMBO J. 2017;36:1736–1754. doi: 10.15252/embj.201696048. - DOI - PMC - PubMed

Publication types

MeSH terms