Heterogeneity of gut microbial responses in healthy household dogs transitioning from an extruded to a mildly cooked diet
- PMID: 34249503
- PMCID: PMC8254476
- DOI: 10.7717/peerj.11648
Heterogeneity of gut microbial responses in healthy household dogs transitioning from an extruded to a mildly cooked diet
Abstract
Background: The gut microbiota (GM) is associated with canine health and can be impacted by diet. Dog owners in the U.S. have increasingly shown an interest in feeding their dogs a mildly cooked (MC) diet. However, its impact on canine GM and health remains largely unknown.
Methods: Healthy household dogs were tracked upon switching from various brands of extruded to MC diets for four weeks. A health assessment was completed and stool samples were collected by each owner before (day 0) and after the diet transition (day 28). Shotgun metagenomic sequencing was performed at both time points to characterize the GM.
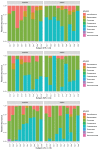
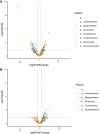
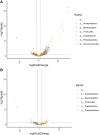
Results: Dogs completed the study by either completing the health assessments (n = 31) or providing stool samples at both time points (n = 28). All owners reported either better or no change in overall health at the end of the study (61% and 39%, respectively), and none reported worse overall health. Defecation frequency was also reported to be lower (58%) or about the same (35%). Principal coordinate (PCo) analysis showed a significant shift (p = 0.004) in the β-diversity of the GM upon diet transition (34.2% and 10.3% explained by the first two axes). The abundances of 70 species increased after the diet change (adjusted p < 0.05), 67% and 24% of which belonged to the Lactobacillales and the Enterobacterales orders respectively. The abundances of 28 species decreased (adjusted p < 0.05), 46%, 18%, and 11% of which belonged to the Clostridiales, Bacillales, and Bacteroidales orders, respectively. Lower Lactobacillales and Enterobacterales, and higher Bacteroidales at baseline were associated with a greater shift along the PCo1 axis. Protein content of the baseline diet was correlated with the shift along the PCo1 axis (ρ = 0.67, p = 0.006).
Conclusion: Owners reported either improvement or no change in health in dogs transitioning from extruded kibble to MC diets for 4 weeks, but this report of health perception requires further exploration in a controlled trial. Diet change also led to a significant shift in the GM profile of healthy dogs. The magnitude of shift was associated with baseline GM and dietary protein, and warrants further examination of individualized responses and personalized nutrition in companion dogs. These results also support future investigation of the impact of a MC diet on health maintenance given its increasing popularity.
Keywords: Canine microbiome; Canine nutrition; Diet processing; Dog kibble; Fresh food; Pet food.
© 2021 Tanprasertsuk et al.
Conflict of interest statement
Jirayu Tanprasertsuk, Justin Shmalberg, LeeAnn M. Perry, Ryan W. Honaker are employees of and/or hold stocks or stock options in NomNomNow, Inc. Aashish R. Jha, Heather Maughan, Devon E. Tate consult for NomNomNow, Inc.
Figures


Similar articles
-
Effects of a mildly cooked human-grade dog diet on gene expression, skin and coat health measures, and fecal microbiota of healthy adult dogs.J Anim Sci. 2022 Oct 1;100(10):skac265. doi: 10.1093/jas/skac265. J Anim Sci. 2022. PMID: 35965387 Free PMC article.
-
The microbiota of healthy dogs demonstrates individualized responses to synbiotic supplementation in a randomized controlled trial.Anim Microbiome. 2021 May 10;3(1):36. doi: 10.1186/s42523-021-00098-0. Anim Microbiome. 2021. PMID: 33971985 Free PMC article.
-
Apparent total tract nutrient digestibility and metabolizable energy estimation in commercial fresh and extruded dry kibble dog foods.Transl Anim Sci. 2021 May 27;5(3):txab071. doi: 10.1093/tas/txab071. eCollection 2021 Jul. Transl Anim Sci. 2021. PMID: 34278234 Free PMC article.
-
Microbiota and probiotics in canine and feline welfare.Anaerobe. 2015 Aug;34:14-23. doi: 10.1016/j.anaerobe.2015.04.002. Epub 2015 Apr 8. Anaerobe. 2015. PMID: 25863311 Free PMC article. Review.
-
Gut microbiota of humans, dogs and cats: current knowledge and future opportunities and challenges.Br J Nutr. 2015 Jan;113 Suppl:S6-17. doi: 10.1017/S0007114514002943. Epub 2014 Nov 21. Br J Nutr. 2015. PMID: 25414978 Review.
Cited by
-
Analysis and Comparison of Gut Microbiome in Young Detection Dogs.Front Microbiol. 2022 Apr 19;13:872230. doi: 10.3389/fmicb.2022.872230. eCollection 2022. Front Microbiol. 2022. PMID: 35516435 Free PMC article.
-
Determination of Bile Acids in Canine Biological Samples: Diagnostic Significance.Metabolites. 2024 Mar 22;14(4):178. doi: 10.3390/metabo14040178. Metabolites. 2024. PMID: 38668306 Free PMC article. Review.
-
A Randomized Controlled Trial to Evaluate the Impact of a Novel Probiotic and Nutraceutical Supplement on Pruritic Dermatitis and the Gut Microbiota in Privately Owned Dogs.Animals (Basel). 2024 Jan 30;14(3):453. doi: 10.3390/ani14030453. Animals (Basel). 2024. PMID: 38338095 Free PMC article.
-
Comprehensive profile of the companion animal gut microbiome integrating reference-based and reference-free methods.ISME J. 2024 Jan 8;18(1):wrae201. doi: 10.1093/ismejo/wrae201. ISME J. 2024. PMID: 39394961 Free PMC article.
-
Homemade Diet as a Paramount for Dogs' Health: A Descriptive Analysis.Vet Sci. 2024 Sep 17;11(9):438. doi: 10.3390/vetsci11090438. Vet Sci. 2024. PMID: 39330817 Free PMC article.
References
-
- Al-Ghalith G, Knights D. BURST enables optimal exhaustive DNA alignment for big data. https://github.com/knights-lab/burst GitHub. 2017
-
- Alessandri G, Milani C, Mancabelli L, Mangifesta M, Lugli GA, Viappiani A, Duranti S, Turroni F, Ossiprandi MC, Van Sinderen D, Ventura M. Metagenomic dissection of the canine gut microbiota: insights into taxonomic, metabolic and nutritional features. Environmental Microbiology. 2019;21(4):1331–1343. doi: 10.1111/1462-2920.14540. - DOI - PubMed
-
- Alexander C, Cross T-WL, Devendran S, Neumer F, Theis S, Ridlon JM, Suchodolski JS, De Godoy MRC, Swanson KS. Effects of prebiotic inulin-type fructans on blood metabolite and hormone concentrations and faecal microbiota and metabolites in overweight dogs. The British Journal of Nutrition. 2018;120(6):1–10. doi: 10.1017/S0007114518001952. - DOI - PubMed
Grants and funding
LinkOut - more resources
Full Text Sources

