. 2021 Jul 9;7(1):59.
doi: 10.1038/s41522-021-00225-4.

Identification of small molecules that interfere with c-di-GMP signaling and induce dispersal of Pseudomonas aeruginosa biofilms

Affiliations

Identification of small molecules that interfere with c-di-GMP signaling and induce dispersal of Pseudomonas aeruginosa biofilms

Jens Bo Andersen et al. NPJ Biofilms Microbiomes. .

Abstract

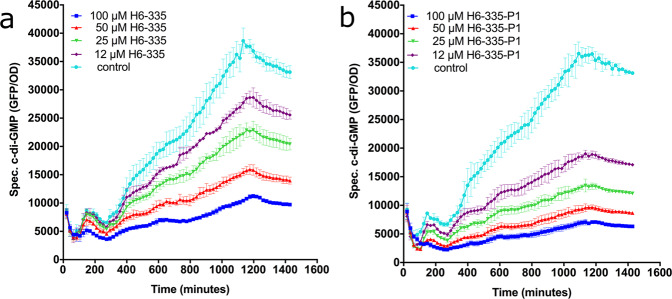
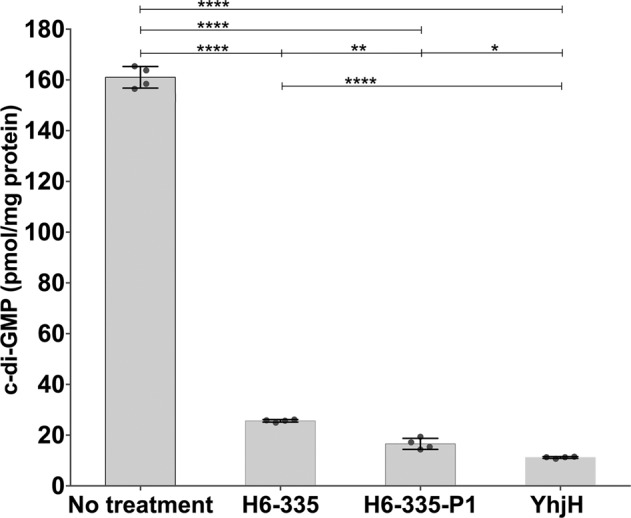
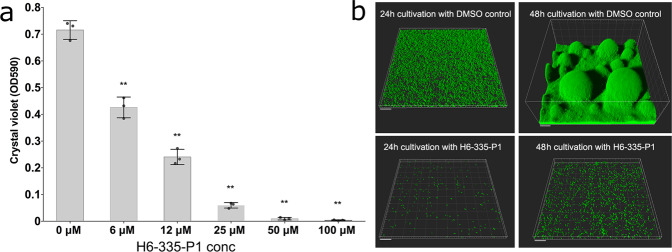
Microbial biofilms are involved in a number of infections that cannot be cured, as microbes in biofilms resist host immune defenses and antibiotic therapies. With no strict biofilm-antibiotic in the current pipelines, there is an unmet need for drug candidates that enable the current antibiotics to eradicate bacteria in biofilms. We used high-throughput screening to identify chemical compounds that reduce the intracellular c-di-GMP content in Pseudomonas aeruginosa. This led to the identification of a small molecule that efficiently depletes P. aeruginosa for c-di-GMP, inhibits biofilm formation, and disperses established biofilm. A combination of our lead compound with standard of care antibiotics showed improved eradication of an implant-associated infection established in mice. Genetic analyses provided evidence that the anti-biofilm compound stimulates the activity of the c-di-GMP phosphodiesterase BifA in P. aeruginosa. Our work constitutes a proof of concept for c-di-GMP phosphodiesterase-activating drugs administered in combination with antibiotics as a viable treatment strategy for otherwise recalcitrant infections.


Conflict of interest statement

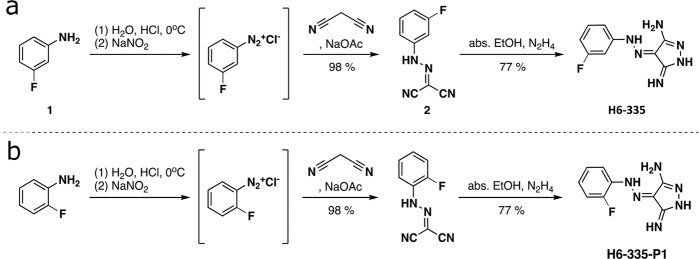
The authors declare that there are no competing interests. The anti-biofilm activity of the H6-335 and H6-335-P1 compounds is protected with a patent application filed (priority date) 20.10.2020 - application no. 20193050.0-1110.

Figures

Fig. 1
Fig. 1. H6-335 and H6-335-P1 reduce the c-di-GMP content in P. aeruginosa.
Effects of H6-335 (a) and H6-335-P1 (b) on the fluorescence output of the c-di-GMP monitor strain P. aeruginosa ΔwspFΔpelΔpsl/pCdrA-gfp. Bacteria were grown in the wells of microtiter plates in the presence of various concentrations of H6-335 or H6-335-P1. GFP fluorescence was measured every 20 min for 24 h. Specific c-di-GMP levels (GFP/OD600) are plotted as a function of time and H6-335 or H6-335-P1 concentration. Mean and standard deviation (bars) of three biological replicates (n = 3) are shown.
Fig. 2
Fig. 2. Chemical synthesis of H6-335 and H6-335-P1.
Synthesis of (Z)-4-(2-(3-fluorophenyl)hydrazineylidene)-5-imino-4,5-dihydro-1H-pyrazol-3-amine (H6-335) (a) and 4-[(2-fluorophenyl) hydrazinylidene]pyrazole-3,5-diamine (H6-335-P1) (b) in a two-step procedure involving diazotation of the arylamines and condensation with malonodinitrile, followed by cyclocondensation with hydrazine.
Fig. 3
Fig. 3. Effect of H6-335 and H6-335-P1 on the c-di-GMP level of P. aeruginosa ΔwspFΔpelΔpsl determined by HPLC coupled MS-MS.
Bacteria were grown as 25 ml cultures in 250 ml Erlenmeyer flasks in the presence of 100 μM H6-335, 100 μM H6-335-P1, or 0.05% DMSO as control. Following 8 h of growth (early stationary phase), samples for c-di-GMP and protein quantification were collected from each of the three cultures. P. aeruginosa ∆wspF∆pel∆psl/pYhjHG containing plasmid pYhjHG-encoded YhjH phosphodiesterase was included as an additional control. Mean and standard deviation (bars) of c-di-GMP contents normalized to protein contents are shown for four biological replicates (n = 4). Significance levels are based on one-way ANOVA analysis with Sidak’s multiple comparisons test (*p < 0.05, **p < 0.01, ****p < 0.0001).
Fig. 4
Fig. 4. H6-335-P1-mediated inhibition of P. aeruginosa biofilm formation.
a P. aeruginosa was cultivated for 10 h in the wells of microtiter plates in the presence of various concentrations of H6-335-P1. Subsequently, the amounts of biofilm in the wells were quantified using a crystal violet assay. Mean and standard deviation (bars) of three biological replicates (n = 3) are shown. One-way ANOVA analysis with Sidak’s multiple comparisons test was used to calculate significance values (**p < 0.01). b Gfp-tagged P. aeruginosa was cultivated in flow-cells perfused with growth medium with or without 25 μM H6-336-P1. CLSM micrographs of the adherent bacteria were acquired after 24 and 48 h of cultivation. Simulated 3D fluorescence projections were generated from the CLSM image stacks using IMARIS software. The size bars correspond to 20 μm.
Fig. 5
Fig. 5. H6-335-P1-mediated dispersal of P. aeruginosa biofilms.
a P. aeruginosa biofilms were grown in the wells of microtiter trays as 12 biological replicates (n = 12). After 18 h of cultivation 25 μM H6-335-P1 (n = 6, open circles) or 1% DMSO-control (n = 6, filled circles) was added. Subsequently, at the time-points indicated, samples were withdrawn and plated for CFU determinations. Average CFU’s per ml for the DMSO controls at each time point were set to 100. Horizontal bars represent mean values. Two-way ANOVA analysis with Sidak’s multiple comparisons test was used to calculate significance values (*p < 0.05, ****p < 0.0001). b A biofilm of Gfp-tagged P. aeruginosa was cultivated in a flow-cell irrigated with growth medium supplemented with 0.025% DMSO. After 48 h of cultivation, the flow-through medium was shifted so that it contained 0.025% DMSO and 25 μM H6-335-P1. CLSM micrographs were acquired before and 4 h after the introduction of H6-336-P1. Simulated 3D fluorescence projections were generated from the CLSM image stacks using IMARIS software. The size bars correspond to 20 μm.
Fig. 6
Fig. 6. Antibiotic time-kill assay of P. aeruginosa biofilms and dispersed cells.
Biofilms were grown on pegs for 24 h, and were subsequently treated with 100 μM H6-335-P1 or DMSO-control for 2 h. Biofilms treated with H6-335-P1 (□) and DMSO-control (■), as well as dispersed cells (〇) were then challenged with 30 µg/ml tobramycin (a) or 0.5 µg/ml ciprofloxacin (b). The biofilms were disrupted at 0, 2, 4, 6, and 8 h, and planktonic cells were withdrawn at 0, 1, 2, 3, and 4 h, and the bacteria were plated on agar plates for CFU determination. Mean values and standard deviation (bars) of three biological replicates (n = 3) are shown.
Fig. 7
Fig. 7. Treatment of biofilm infections with H6-335-P1 and antibiotics.
Silicone implants were incubated with P. aeruginosa cultures for 20 h for bacterial adhesion. At time zero, mice had implants inserted in the peritoneal cavity. At 24 h and 26 h post insertion of the implants (PI), the mice were treated with either H6-335-P1 (H6 P1) (25 μM corresponding to 6 μg compound per gram of bodyweight) or vehicle (as placebo), and at 26 h PI the mice received 30 μg tobramycin (TOB) per gram bodyweight or 0.9% NaCl (a), or alternatively at 24 h PI the mice received 10 μg ciprofloxacin (CIP) per gram bodyweight or 0.9% NaCl (b). At 28 h PI, the mice were euthanized and the CFU per implant was determined. The median CFU per implant for the placebo group was set to 100. The median CFU per implant for the placebo groups were 8.5 × 106 (a) and 1.5 × 106 (b). Horizontal lines indicate median CFU for each group. Each symbol represents a mouse. Significance levels are based on Mann–Whitney U test (analysis of non-parametric data).
Fig. 8
Fig. 8. The presence of H6-335-P1 results in activation of the BifA protein.
Macrocolonies were grown from 5 μl overnight culture of P. aeruginosa ΔbifAΔwspF PBAD-bifA or P. aeruginosa ΔbifAΔwspF spotted on agar plates supplemented with, respectively, Congo Red, Congo Red and arabinose, Congo Red and H6-335-P1, or Congo Red, arabinose and H6-335-P1. Photographs of the macrocolonies were acquired after 48 h incubation at 30°C.
Fig. 9
Fig. 9. A functional BifA is required for H6-335-P1-induced dispersal of P. aeruginosa biofilm.
Biofilms of the P. aeruginosa wild-type and PDE mutants were grown in the wells of microtiter trays for 18 h, at which time point 100 μM H6-335-P1 or DMSO-control was added to the wells. After 2 hours of further incubation, the culture supernatants were discarded and the amount of biofilm present in the wells was quantified by crystal violet staining. The graph shows relative values, where the average crystal violet value of each DMSO-control was set to 100. Mean value and standard deviation (bars) of 11 biological replicates (n = 11) are shown. One-way ANOVA analysis with Sidak’s multiple comparisons test was used to calculate significance values between control and H6-335-P1-treated. P < 0.0001 was found for all comparisons, except PA4367 (bifA) for which H6-335-P1-treated was not significantly different from the control (p > 0.05).
Fig. 10
Fig. 10. Heat-map showing the expression level of selected genes determined by RNA-seq analysis of H6-335-P1-treated P. aeruginosa ΔwspFΔpelΔpsl compared with untreated control.
The results are based on three biological experiments (n = 3). OD: Cell densities measured as OD600 values.

Similar articles

Cited by

References

    1. Costerton JW, Stewart PS, Greenberg EP. Bacterial biofilms: a common cause of persistent infections. Science. 1999;284:1318–1322. doi: 10.1126/science.284.5418.1318. - DOI - PubMed
    1. Ciofu O, Tolker-Nielsen T. Tolerance and resistance of pseudomonas aeruginosa biofilms to antimicrobial agents-how p. aeruginosa can escape antibiotics. Front. Microbiol. 2019;10:913. doi: 10.3389/fmicb.2019.00913. - DOI - PMC - PubMed
    1. Tolker-Nielsen, T. Pseudomonas aeruginosa biofilm infections: from molecular biofilm biology to new treatment possibilities. APMIS Suppl., 1-51, (2014). - PubMed
    1. Bryers JD. Medical biofilms. Biotechnol. Bioeng. 2008;100:1–18. doi: 10.1002/bit.21838. - DOI - PMC - PubMed
    1. Bjarnsholt, T. The role of bacterial biofilms in chronic infections. APMIS Supp.l, 1-51, (2013). - PubMed

Publication types

MeSH terms