Multiscale modeling of genome organization with maximum entropy optimization
- PMID: 34241389
- PMCID: PMC8253599
- DOI: 10.1063/5.0044150
Multiscale modeling of genome organization with maximum entropy optimization
Abstract
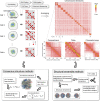
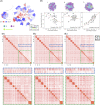
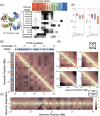
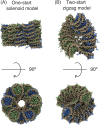
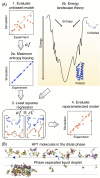
Three-dimensional (3D) organization of the human genome plays an essential role in all DNA-templated processes, including gene transcription, gene regulation, and DNA replication. Computational modeling can be an effective way of building high-resolution genome structures and improving our understanding of these molecular processes. However, it faces significant challenges as the human genome consists of over 6 × 10⁹ base pairs, a system size that exceeds the capacity of traditional modeling approaches. In this perspective, we review the progress that has been made in modeling the human genome. Coarse-grained models parameterized to reproduce experimental data via the maximum entropy optimization algorithm serve as effective means to study genome organization at various length scales. They have provided insight into the principles of whole-genome organization and enabled de novo predictions of chromosome structures from epigenetic modifications. Applications of these models at a near-atomistic resolution further revealed physicochemical interactions that drive the phase separation of disordered proteins and dictate chromatin stability in situ. We conclude with an outlook on the opportunities and challenges in studying chromosome dynamics.
Figures




Similar articles
-
Maximum Entropy Optimized Force Field for Intrinsically Disordered Proteins.J Chem Theory Comput. 2020 Jan 14;16(1):773-781. doi: 10.1021/acs.jctc.9b00932. Epub 2019 Dec 13. J Chem Theory Comput. 2020. PMID: 31756104 Free PMC article.
-
An integrated 3-Dimensional Genome Modeling Engine for data-driven simulation of spatial genome organization.Genome Res. 2016 Dec;26(12):1697-1709. doi: 10.1101/gr.205062.116. Epub 2016 Oct 27. Genome Res. 2016. PMID: 27789526 Free PMC article.
-
Coarse-Graining of TIP4P/2005, TIP4P-Ew, SPC/E, and TIP3P to Monatomic Anisotropic Water Models Using Relative Entropy Minimization.J Chem Theory Comput. 2014 Sep 9;10(9):4104-20. doi: 10.1021/ct500487h. Epub 2014 Aug 1. J Chem Theory Comput. 2014. PMID: 26588552
-
New strategies for integrative dynamic modeling of macromolecular assembly.Adv Protein Chem Struct Biol. 2014;96:77-111. doi: 10.1016/bs.apcsb.2014.06.008. Epub 2014 Sep 30. Adv Protein Chem Struct Biol. 2014. PMID: 25443955 Review.
-
Bridging the resolution gap in structural modeling of 3D genome organization.PLoS Comput Biol. 2011 Jul;7(7):e1002125. doi: 10.1371/journal.pcbi.1002125. Epub 2011 Jul 14. PLoS Comput Biol. 2011. PMID: 21779160 Free PMC article. Review.
Cited by
-
A Molecular View into the Structure and Dynamics of Phase-Separated Chromatin.J Phys Chem B. 2024 Oct 31;128(43):10593-10603. doi: 10.1021/acs.jpcb.4c04420. Epub 2024 Oct 16. J Phys Chem B. 2024. PMID: 39413416 Free PMC article.
-
A Liquid State Perspective on Dynamics of Chromatin Compartments.Front Mol Biosci. 2022 Jan 13;8:781981. doi: 10.3389/fmolb.2021.781981. eCollection 2021. Front Mol Biosci. 2022. PMID: 35096966 Free PMC article. Review.
-
From Nucleosomes to Compartments: Physicochemical Interactions Underlying Chromatin Organization.Annu Rev Biophys. 2024 Jul;53(1):221-245. doi: 10.1146/annurev-biophys-030822-032650. Epub 2024 Jun 28. Annu Rev Biophys. 2024. PMID: 38346246 Free PMC article. Review.
-
Dynamics and Pathways of Chromosome Structural Organizations during Cell Transdifferentiation.JACS Au. 2021 Dec 9;2(1):116-127. doi: 10.1021/jacsau.1c00416. eCollection 2022 Jan 24. JACS Au. 2021. PMID: 35098228 Free PMC article.
-
Quantifying cell-cycle-dependent chromatin dynamics during interphase by live 3D tracking.iScience. 2022 Apr 4;25(5):104197. doi: 10.1016/j.isci.2022.104197. eCollection 2022 May 20. iScience. 2022. PMID: 35494233 Free PMC article.
References
-
- Liu X., Milshina N., Glasser K., Nelson K., Hannenhalli S., Chaturvedi K., Wolfe K., Gabor Miklos G. L., Carnes-Stine J., Turner R., Rodriguez R., Lewis M., Rowe W., Lu F., Caminha M., Kalush F., Brandon R., Zhang Q., Lei Y., Glodek A., Bafna V., Busam D., Thomas P. D., Vech C., Flanigan M., Peterson M., Wang A., Gluecksmann A., Sanders R., Kraft C., Wides R., Roberts R. J., Zhong W., Ye J., Gilbert D., Wang G., Mobarry C., Pratts E., Zhu X., Curry L., Fosler C., McIntosh T., Gire H., Neelam B., Spier G., Dahlke C., Zhang H., Sutton G. G., Venter J. C., Subramanian G., Stewart E., An H., Istrail S., Nguyen N., Ketchum K. A., Wu D., Sitter C., Kline L., Zhan M., Jordan C., Lippert R., Esparham S., Zhang J., Charlab R., Hart B., Abu-Threideh J., Gorokhov M., Evangelista C., Allen D., Xiao C., Scott R., Ma D., Muruganujan A., Kejariwal A., Zhong F., Tint N. N., Mural R. J., Hladun S., Garg N., Amanatides P., Ji R.-R., Ke Z., Kasha J., Adams M. D., Guan P., Pan S., Gu Z., Donnelly M., Lai Z., Beasley E., Suh E., Zheng X. H., Baldwin D., Heiman T. J., Wei M.-H., Peck J., Venter E., Yan C., Jordan J., Naik A. K., Hoover J., Nodell M., Guo N., Wetter J., Qureshi H., Awe A., Evans C. A., Sprague A., Simpson M., Howland T., Mays A. D., Nusskern D., Rusch D. B., Ge W., Francesco V. D., Levine A. J., Zhu S. C., Gocayne J. D., Yandell M., Basu A., McKusick V. A., Schwartz R., Remington K., Liang Y., Smith H. O., Rogers Y.-H., Wang X., Zinder N., Carter C., Sjolander K. V., Moy L., Majoros W., Moore H. M., Thomas R., Merkulov G. V., Baumhueter S., Salzberg S., Johnson J., Bonazzi V., Ballew R. M., Jennings D., Smith T., Wang Z. Y., Heil J., Delcher A., Myers E. W., Moy M., Narayan V. A., Dew I., Gan W., Higgins M. E., Wang J., Strong R., Baden H., Desilets R., Holt R. A., Hatton T., Stockwell T., Houck J., Gong F., Puri V., Kravitz S., Dodson K., Mann F., Karlak B., Koduru S., Shao W., Tse S., Lopez J., Chen L., Wen M., Clark A. G., Bolanos R., Biddick K., Gabrielian A. E., Nguyen T., Shue B., Eilbeck K., Yooseph S., Doup L., Pfannkoch C., Zhao Q., Beeson K., Zhao S., Halpern A., Fasulo D., Chandramouliswaran I., Davenport L., Cravchik A., Sato S., Heiner C., McCawley S., Danaher S., Deng Z., Windsor S., Ali F., May D., Zaveri K., Cheng M. L., Simon M., Carver A., Baxendale J., Broder S., Huson D. H., Hostin D., Lin X., Guigó R., Romblad D., Levy S., Hunkapiller M., Ibegwam C., Yao A., Haynes C., Ely D., Wang M., Nelson C., Chiang Y.-H., Nadeau J., Zheng L., Reardon M., Levitsky A., Harris M., Williams M., Ferriera S., Ruhfel B., Li P. W., Dunn P., Li J., Slayman C., Murphy B., Caulk P., Graham K., Wu M., Glanowski S., Florea L., Coyne M., Love A., Murphy S., Li Z., Lazareva B., Zaveri J., Xia A., Newman M., Wortman J. R., McDaniel J., Woodage T., McMullen I., Kagan L., Haynes J., Sun J., Center A., Campbell M. J., Smallwood M., Blick L., Diemer K., Henderson S., Kodira C. D., Winn-Deen E., Zandieh A., Zhang W., Walenz B., Gropman B., Barnstead M., Reinert K., Williams S., Mi H., Barrow I., Cargill M., Abril J. F., Narechania A., Dombroski M., Scott J., Dietz S., and Skupski M., “The sequence of the human genome,” Science 291, 1304–1351 (2002).10.1126/science.1058040 - DOI - PubMed
-
- Schrödinger E., What is Life?, Canto Classics (Cambridge University Press, 2014).
-
- Roadmap Epigenomics Consortium, Kundaje A., Meuleman W., Ernst J., Bilenky M., Yen A., Heravi-Moussavi A., Kheradpour P., Zhang Z., Wang J., Ziller M. J., Amin V., Whitaker J. W., Schultz M. D., Ward L. D., Sarkar A., Quon G., Sandstrom R. S., Eaton M. L., Wu Y.-C., Pfenning A. R., Wang X., Claussnitzer M., Liu Y., Coarfa C., Harris R. A., Shoresh N., Epstein C. B., Gjoneska E., Leung D., Xie W., Hawkins R. D., Lister R., Hong C., Gascard P., Mungall A. J., Moore R., Chuah E., Tam A., Canfield T. K., Hansen R. S., Kaul R., Sabo P. J., Bansal M. S., Carles A., Dixon J. R., Farh K.-H., Feizi S., Karlic R., Kim A.-R., Kulkarni A., Li D., Lowdon R., Elliott G., Mercer T. R., Neph S. J., Onuchic V., Polak P., Rajagopal N., Ray P., Sallari R. C., Siebenthall K. T., Sinnott-Armstrong N. A., Stevens M., Thurman R. E., Wu J., Zhang B., Zhou X., Beaudet A. E., Boyer L. A., De Jager P. L., Farnham P. J., Fisher S. J., Haussler D., Jones S. J. M., Li W., Marra M. A., McManus M. T., Sunyaev S., Thomson J. A., Tlsty T. D., Tsai L.-H., Wang W., Waterland R. A., Zhang M. Q., Chadwick L. H., Bernstein B. E., Costello J. F., Ecker J. R., Hirst M., Meissner A., Milosavljevic A., Ren B., Stamatoyannopoulos J. A., Wang T., and Kellis M., “Integrative analysis of 111 reference human epigenomes,” Nature 518, 317–329 (2015).10.1038/nature14248 - DOI - PMC - PubMed
MeSH terms
Substances
Grants and funding
LinkOut - more resources
Full Text Sources

