. 2021 Jul 7;12(1):4170.
doi: 10.1038/s41467-021-24407-y.

M1BP cooperates with CP190 to activate transcription at TAD borders and promote chromatin insulator activity

Affiliations

M1BP cooperates with CP190 to activate transcription at TAD borders and promote chromatin insulator activity

Indira Bag et al. Nat Commun. .

Abstract

Genome organization is driven by forces affecting transcriptional state, but the relationship between transcription and genome architecture remains unclear. Here, we identified the Drosophila transcription factor Motif 1 Binding Protein (M1BP) in physical association with the gypsy chromatin insulator core complex, including the universal insulator protein CP190. M1BP is required for enhancer-blocking and barrier activities of the gypsy insulator as well as its proper nuclear localization. Genome-wide, M1BP specifically colocalizes with CP190 at Motif 1-containing promoters, which are enriched at topologically associating domain (TAD) borders. M1BP facilitates CP190 chromatin binding at many shared sites and vice versa. Both factors promote Motif 1-dependent gene expression and transcription near TAD borders genome-wide. Finally, loss of M1BP reduces chromatin accessibility and increases both inter- and intra-TAD local genome compaction. Our results reveal physical and functional interaction between CP190 and M1BP to activate transcription at TAD borders and mediate chromatin insulator-dependent genome organization.


Conflict of interest statement

The authors declare no competing interests.

Figures

Fig. 1
Fig. 1. Co-immunoprecipitation of core gypsy components with M1BP.
a Nuclear extracts (NE) from embryos aged 0–24 h were immunoprecipitated with either normal guinea pig serum or guinea pig anti-Su(Hw) antibody. Unbound supernatant (Sup) and bound (IP) fractions are shown. Polycomb (Pc) is shown as a negative control. In all, 10% of NE is loaded in the gel. We calculated that 5.2% of total CP190, 7.2% of Su(Hw), 1.9% of Mod(mdg4)67.2, and 5.3% of M1BP were immunoprecipitated with anti-Su(Hw) antibody. b Immunoprecipitation of M1BP with normal guinea pig serum or guinea pig anti-CP190 is shown. Overall, 12% of total CP190, 7.0% of Su(Hw), 8.2% of Mod(mdg4)67.2, and 3.8% of M1BP were immunoprecipitated with anti-CP190 antibody. c Immunoprecipitation of M1BP with normal rabbit serum or rabbit anti-Mod(mdg4)67.2 is shown. Overall, 11% of total CP190, 8.5% of Su(Hw), 10% of Mod(mdg4)67.2, and 3.0% of M1BP were immunoprecipitated with anti-Mod(mdg4)67.2 antibody. d Immunoprecipitation of M1BP with normal rabbit serum or rabbit anti-M1BP is shown. Overall, 3.8% of total CP190, 2.6% of Su(Hw), 1.4% of Mod(mdg4)67.2, and 3.7% of M1BP were immunoprecipitated with anti-M1BP antibody. Samples from the same experiment were run on different gels for proteins with similar molecular weights. All western blotting experiments were performed with at least two independent biological replicates for each antibody, and a single experiment is shown.
Fig. 2
Fig. 2. M1BP promotes gypsy-dependent enhancer-blocking and barrier activities.
a Western blotting of male third instar larval extracts for M1BP, insulator proteins, and Pep loading control in control and M1BPRNAi knockdown flies using Act5C-Gal4 driver. Samples from the same experiment were run on different lanes of the same gel for proteins with similar molecular weights. Western blotting experiments were performed using two independent biological replicates with similar results. b M1BP promotes enhancer-blocking activity at ct6. Top: schematic diagram of reporter system. The gypsy retrotransposon is inserted in between the promoter of cut and wing margin (EnWing) enhancer. Bottom: insulator activity for ct6 was scored in male flies on a scale of 0–4. 0, no notching; 1, slight notching in anterior tip of wing; 2, mild notching throughout posterior wing; 3, extensive notching both in anterior and posterior wing; 4, severe notching throughout the anterior and posterior wing. c Graph represents quantification of ct6 wing phenotype of male wild-type (+/+) and M1BPRNAi using Ser-Gal4 driver. n, total number of flies scored. d Depletion of M1BP shows reduced gypsy-dependent barrier activity in all tissues tested. Schematic diagram of non-insulated UAS-luciferase system shows spreading of repressive chromatin can reduce luciferase expression, but presence of the gypsy insulator acts as a barrier and allows for luciferase activity. e Relative luciferase activity of insulated or non-insulated male larvae of control and M1BPRNAi driven by Act5C-Gal4 driver, f Mef2-Gal4 driver, and g l(3)31-1-Gal4 driver. Luciferase values of all genotypes are plotted as box and whisker plots using one-way ANOVA followed by Tukey HSD post hoc tests to calculate P values for pairwise comparisons. The box represents the 25–75th percentiles, and the median is indicated. The whiskers show the minimum and maximum values. For each genotype, n = 12 individual larvae. Bracket indicates P values of two-way comparisons (*P < 0.05) and all comparisons are shown in Supplementary Table 4.
Fig. 3
Fig. 3. M1BP extensively colocalizes specifically with CP190 throughout the genome.
a Western blotting of total lysates from Kc control and M1BP knockdown cells showing knockdown efficiency of M1BP and no effects on protein levels of insulator proteins, with Pep as loading control. Samples from the same experiment were run on different lanes of the same gel for proteins with similar molecular weights. Western blotting was performed for three independent biological replicates with similar results. b Screenshot example of ChIP-seq profiles showing in Kc cells M1BP co-localizing with CP190 but not Su(Hw) or Mod(mdg4)67.2. Asterisk indicates a particular peak of interest measured in Fig. 6c, site 7. c Binary heatmap of M1BP, CP190, Mod(mdg4)67.2, and Su(Hw) binding sites in control cells ordered by supervised hierarchical clustering. Each row represents a single independent genomic location, and a black mark in a column represents the presence of a particular factor: 2461 (79%, purple bar) peaks of 3121 total M1BP peaks overlap with CP190, 163 (5.2%) M1BP peaks overlap with Su(Hw) peaks, and 217 (7%) M1BP peaks overlap with Mod(mdg4)67.2. d Bar plot shows distribution of M1BP, CP190, and gypsy (Su(Hw)/Mod(mdg4)67.2/CP190 all present) binding sites with respect to genomic features. e Heatmaps of M1BP, CP190, Su(Hw), and Mod(mdg4)67.2 peaks in control cells sorted independently by decreasing average ChIP-seq signals normalized to inputs. Reads are centered on 6307 TSSs containing Motif 1 site. The horizontal axis corresponds to distance from TSS with Motif 1 site. f Motif 1 consensus sequence.
Fig. 4
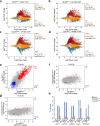
Fig. 4. M1BP and CP190 transcriptionally regulate a common set of genes.
a, b MA plots showing changes in neuRNA levels upon depletion of M1BP. Statistically significant changes include 1315 upregulated genes (red) and 607 downregulated genes (blue) using Padj < 0.05. Unchanged genes are indicated in gray. Gene promoters containing M1BP peaks (a) or CP190 peaks (b) are additionally colored yellow. Two-sided Fisher’s exact test was used. c, d MA plots showing neuRNA-seq affected genes after depletion of CP190. Significantly upregulated genes (1894, red) and downregulated genes (1382, blue) are shown. Genes containing CP190 (c) or M1BP (d) at their promoters are shown in yellow. Fisher’s exact test (two-sided) was used. eg Scatter plots comparing neuRNA-seq profiles of M1BP and Cp190 knockdowns (e), M1BP and mod(mdg4) knockdowns (f), or Cp190 and mod(mdg4) knockdowns (g). Pearson’s R corresponds to correlation coefficient between two profiles. Common upregulated genes are indicated in red, and common downregulated genes are indicated in blue. h Differentially decreased CP190 peaks in M1BPRNAi associated with the promoter of downregulated genes affected in both M1BP and Cp190 knockdowns are verified by ChIP-qPCR. Percent input DNA precipitated is shown for each primer set. Average values from n = 2 biological replicates measured using four technical replicates are shown. Detailed description of each site is summarized in Supplementary Table 5, and Ct values are listed in Source Data 7.
Fig. 5
Fig. 5. M1BP and CP190 both activate Motif 1-containing gene promoters.
a Schematic diagram of plasmids containing wild-type and Motif 1 mutants of ribosomal protein (RP) gene promoter driving luciferase reporters. b Schematic diagram showing RP gene luciferase reporter assay. RpIII128 promoter lacks Motif 1 and serves as a transfection control. c Firefly/Renilla luciferase ratio of relative light unit measurements. Experiments are performed in indicated knockdown conditions. Data represented as mean ± SD from n = 3 biological replicates, and P values were analyzed by two-tailed unpaired t-test. WT RpLP1 Mock vs M1BPRNAi; Mut Motif 1 RpLP1 Mock vs M1BPRNAi; WT RpLP30: Mock vs M1BPRNAi; WT RpLP1 Mock vs Cp190RNAi; and WT RpLP30 Mock vs Cp190RNAi all P = 0.0001, Mut Motif 1 RpLP30 Mock vs M1BPRNAi P = 0.0017, Mut Motif 1 RpLP1 Mock vs Cp190RNAi P = 0.73, Mut Motif 1 RpLP30 Mock vs Cp190RNAi P = 0.89, WT RpLP1 Mock vs mod(mdg4)RNAi P = 0.49, Mut Motif 1 RpLP1 Mock vs mod(mdg4)RNAi P = 0.16, WT RpLP30 Mock vs mod(mdg4)RNAi P = 0.28, Mut Motif 1 RpLP30 Mock vs mod(mdg4)RNAi P = 0.98.
Fig. 6
Fig. 6. M1BP association with chromatin is facilitated by CP190 at a subset of sites.
a Western blotting of total lysates from Kc control and Cp190 knockdown cells with Pep used as loading control. This experiment was performed for three independent biological replicates with similar results. b Example screenshot of ChIP-seq profiles for lost CP190 peak in M1BPRNAi and lost M1BP peak in Cp190RNAi are shown. Asterisk indicates the particular interdependent peak measured in (c), site 1. Called ChIP-seq peaks in either knockdown condition shown in black are significantly decreased in the knockdown of the opposite factor. c Differentially bound M1BP and CP190 ChIP-seq peaks in M1BP knockdown and Cp190 knockdown validated by ChIP-qPCR. Validation of selected differentially decreased peaks of M1BP and CP190 (sites 1–5) and negative control sites (sites 10 and 11). Validation of decreased peaks of CP190 (sites 6–9) and negative control site 12. Percentage input chromatin DNA precipitated is shown for each primer set, and average values from n = 2 biological replicates measured using four technical replicates are plotted. Detailed description of each site labeled is summarized in Supplementary Table 5 and Ct values are available in Source Data 7. d Example screenshot showing promoter association of M1BP and CP190 is interdependent for downregulated genes in either knockdown of M1BP or Cp190. In most cases, both proteins localize at TAD borders. For simplicity, only replicate 1 of mock, M1BPRNAi, and Cp190RNAi is shown for neuRNA-seq tracks. e Cumulative histograms of promoter distance from closest TAD border classified by change in nascent expression in M1BP (left) or Cp190 (right) knockdown cells. Downregulated (blue), upregulated (red), or unchanged (black) genes are indicated. Table indicates the median distance from closest TAD border for down- and upregulated genes compared to unchanged genes in either knockdown condition. Mann–Whitney U test for each set of changed genes against unchanged genes are shown. Analysis of TADs classified by chromatin state is shown in Supplementary Fig. 6. f Percentage of precipitated input chromatin DNA from ChIP-qPCR of M1BP, Su(Hw), Mod(mdg4)67.2, and CP190 at Su(Hw)-binding sites of gypsy or TART transposon sites as a negative control in Kc cells either mock-treated or subjected to M1BPRNAi or Cp190RNAi. Average of n = 2 biological replicates measured using four technical replicates are plotted. Ct values are provided in Source Data 7.
Fig. 7
Fig. 7. Knockdown of M1BP alters nuclear organization of insulator bodies.
a Epifluorescence imaging of insulator body localization using anti-CP190 in whole-mount brain, eye, leg, or wing imaginal disc tissues. M1BP knockdown is driven by Act5C-Gal4 driver. Insets show zoom of single nucleus outlined with dashed line in larger panel. Scale bars: 5 μm. Immunostaining experiments were performed three times with similar results. b Histograms showing the number of insulator bodies per nucleus in the experiment exemplified in (a). In all tissues, the number of insulator bodies is statistically significantly increased in M1BP knockdown (Kruskal–Wallis test; all Benjamini–Hochberg corrected P < 5 × 10–17, n = 100). c Area measurements of individual insulator bodies in brain, eye, leg, and wing imaginal disc tissues of control and M1BP knockdown larvae are shown. Bodies were measured (Tukey plots with outliers omitted, Mann–Whitney test P < 0.001, n = 200). d Area measurements of total insulator bodies per nucleus are shown (Tukey plots with outliers omitted, Mann–Whitney test P < 0.001); Brain: (Control n = 108, M1BPRNAi n = 109), Eye: (Control n = 121, M1BPRNAi n = 168), Leg: (Control n = 107, M1BPRNAi n = 103), Wing: (Control n = 109, M1BPRNAi n = 109). Note that not all cells have discernible nuclear demarcations. c, d Data are presented as boxplots where box represents the 25–75th percentiles and middle line is the median. The upper whisker extends from the hinge to the largest value no further than 1.5 × IQR from the hinge (where IQR is the interquartile range), and the lower whisker extends from the hinge to the smallest value at most 1.5 × IQR of the hinge, while data beyond the end of the whiskers are outlying points that are omitted from the plots.
Fig. 8
Fig. 8. Knockdown of M1BP increases local inter-TAD and intra-TAD genome compaction.
a, d, g Regions detected by 32 kb probes spaced 15 kb apart (a probes G, H, I; d probes J, K, L; g probes M, N, O). TADs with state classification, longest gene isoform, ChIP-seq signals, and called peaks (black significantly decreased in knockdown of opposite factor) are shown. ATAC-seq signals and called peaks, decreased peaks relative to mock (blue), and increased peaks (red) are shown. Upregulated genes in either M1BP or Cp190 knockdown are shown in purple or green, respectively. Downregulated genes in either M1BP or  Cp190 knockdowns text outlined with a box are shown in purple or green, respectively. Note that nkd, Dop1R2, and CR44953 are upregulated in both knockdowns, and CG18135, yrt and Kul are downregulated in both knockdowns. b, e, h Left: representative nuclei labeled with probes in a, d, and g, respectively. Max projection of approximately 5 Z slices. Dashed line represents nuclear edge. Center: zoom of FISH signals. Right: TANGO 3D mesh rendering. c, f, i Dot plots showing average pairwise center-to-center distances between probes in a, d, and g, respectively. Data represented as mean of all replicates (mid-line) ± SD (error bars). Each dot represents the average of one replicate. Single-cell distances were normalized to nuclear radius before population averages were calculated. All averages were normalized to average of mock controls. Only cells in G1 were measured for these analyses. Data are from four biological replicates. See Supplementary Tables 10–12 for “n” of cells examined per replicate. Unpaired t-test (two-tailed) of means before normalization to controls (*P < 0.05, **P < 0.01, ***P < 0.001). Exact P values can be found in Supplementary Table 13.
Fig. 9
Fig. 9. Depletion of M1BP reduces the chromatin accessibility near TAD borders genome-wide.
a Binary heatmap of M1BP ChIP-seq peaks, Mock ATAC-seq peaks, decreased and increased ATAC-seq peaks of M1BPRNAi compared to Mock ordered by supervised hierarchical clustering. Each row represents a single independent genomic location, and a black mark in a column represents the presence of a particular factor. b Average ATAC-seq tagmentation signals of Mock, M1BPRNAi and Cp190RNAi cells for a 4 Kb. genomic window centered on M1BP-binding sites (ChIP-seq peaks). c Average ATAC-seq signals of Mock and M1BPRNAi cells for a 4 Kb genomic window centered on TSS of upregulated genes, d unchanged genes, and e downregulated genes in M1BP knockdown. f Average ATAC-seq signals of Mock, M1BPRNAi, and Cp190RNAi cells are plotted for a 4 Kb genomic window centered at TAD borders. g Cumulative histograms of ATAC-seq peak center distance from closest TAD border classified by change in ATAC-seq peaks in M1BP knockdown cells relative to Mock. Decreased (blue), increased (red), or unchanged (black) ATAC-seq peaks are indicated. Mann–Whitney U test for each set of changed peaks against unchanged peaks is shown.

Similar articles

Cited by

References

    1. Chen D, Lei EP. Function and regulation of chromatin insulators in dynamic genome organization. Curr. Opin. Cell Biol. 2019;58:61–68. doi: 10.1016/j.ceb.2019.02.001. - DOI - PMC - PubMed
    1. Rowley MJ, Corces VG. Organizational principles of 3D genome architecture. Nat. Rev. Genet. 2018;19:789–800. doi: 10.1038/s41576-018-0060-8. - DOI - PMC - PubMed
    1. Kaushal A, et al. CTCF loss has limited effects on global genome architecture in Drosophila despite critical regulatory functions. Nat. Commun. 2021;12:1011. doi: 10.1038/s41467-021-21366-2. - DOI - PMC - PubMed
    1. Rowley MJ, et al. Evolutionarily conserved principles predict 3D chromatin organization. Mol. Cell. 2017;67:837–852. doi: 10.1016/j.molcel.2017.07.022. - DOI - PMC - PubMed
    1. Hug CB, Grimaldi AG, Kruse K, Vaquerizas JM. Chromatin architecture emerges during zygotic genome activation independent of transcription. Cell. 2017;169:216–228. doi: 10.1016/j.cell.2017.03.024. - DOI - PubMed

Publication types

MeSH terms