. 2021 Jul 7;12(7):682.
doi: 10.1038/s41419-021-03972-6.

Primed to die: an investigation of the genetic mechanisms underlying noise-induced hearing loss and cochlear damage in homozygous Foxo3-knockout mice

Affiliations

Primed to die: an investigation of the genetic mechanisms underlying noise-induced hearing loss and cochlear damage in homozygous Foxo3-knockout mice

Holly J Beaulac et al. Cell Death Dis. .

Abstract

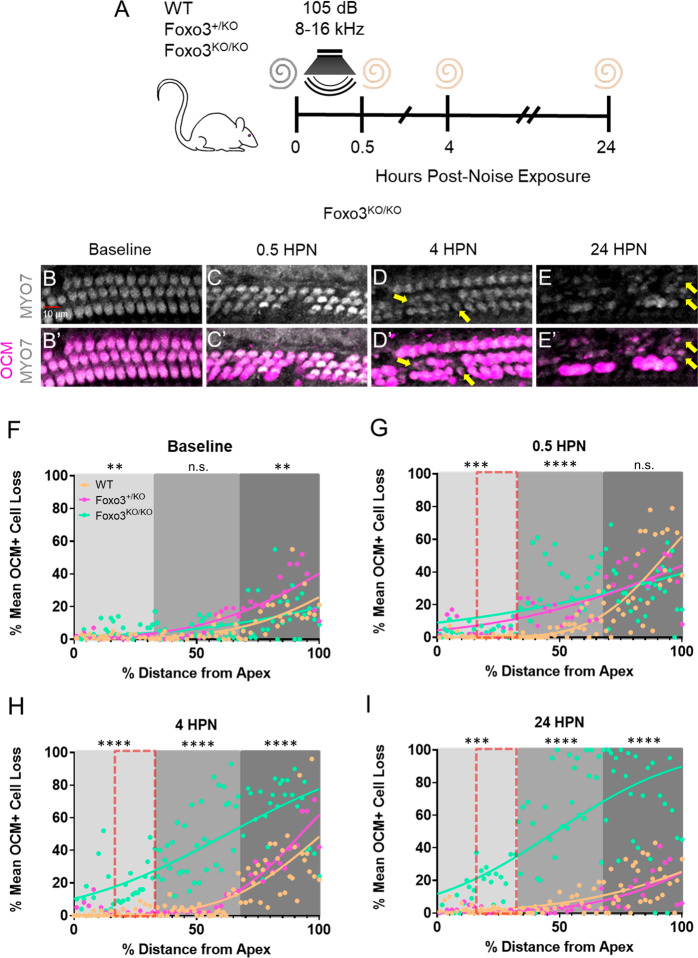
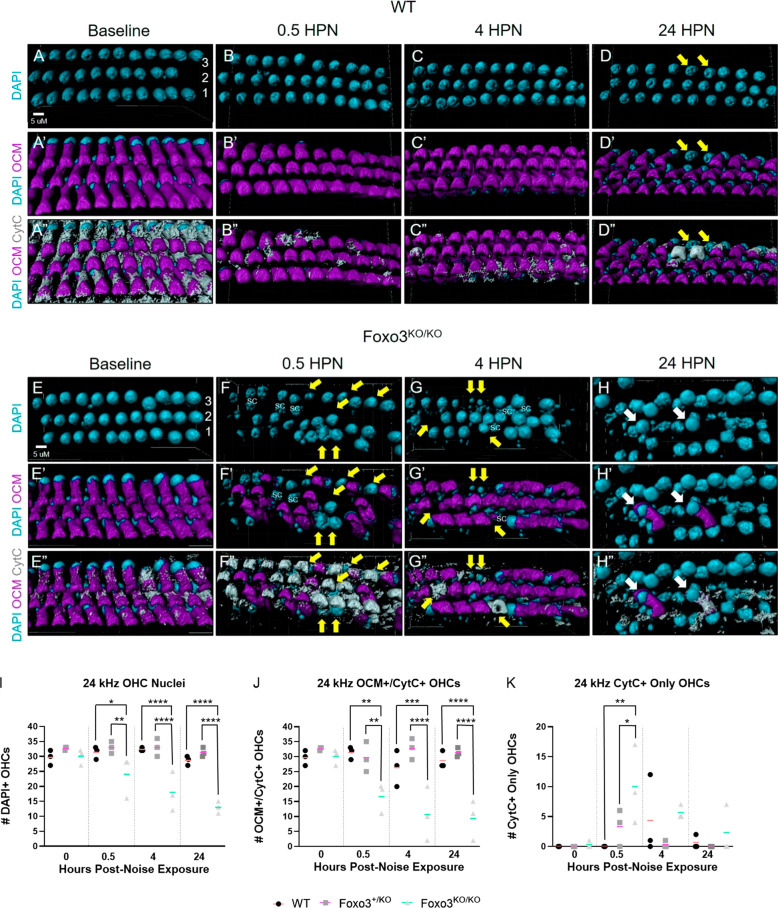
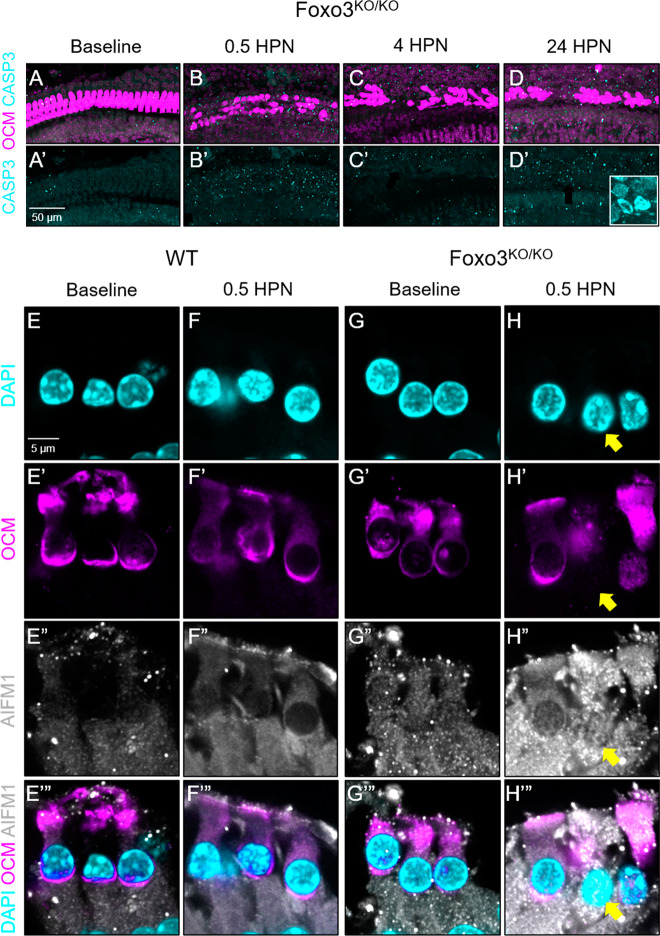
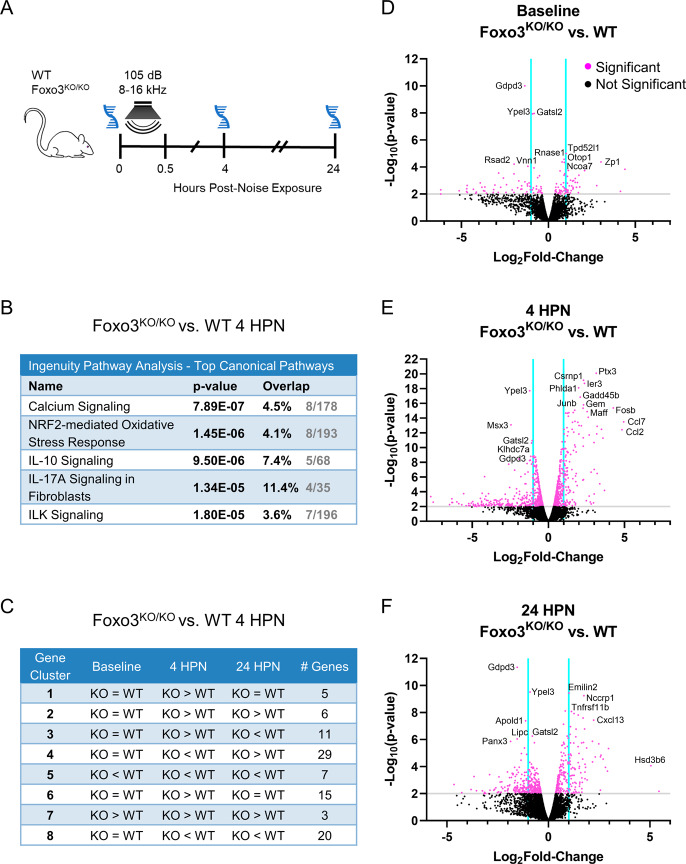
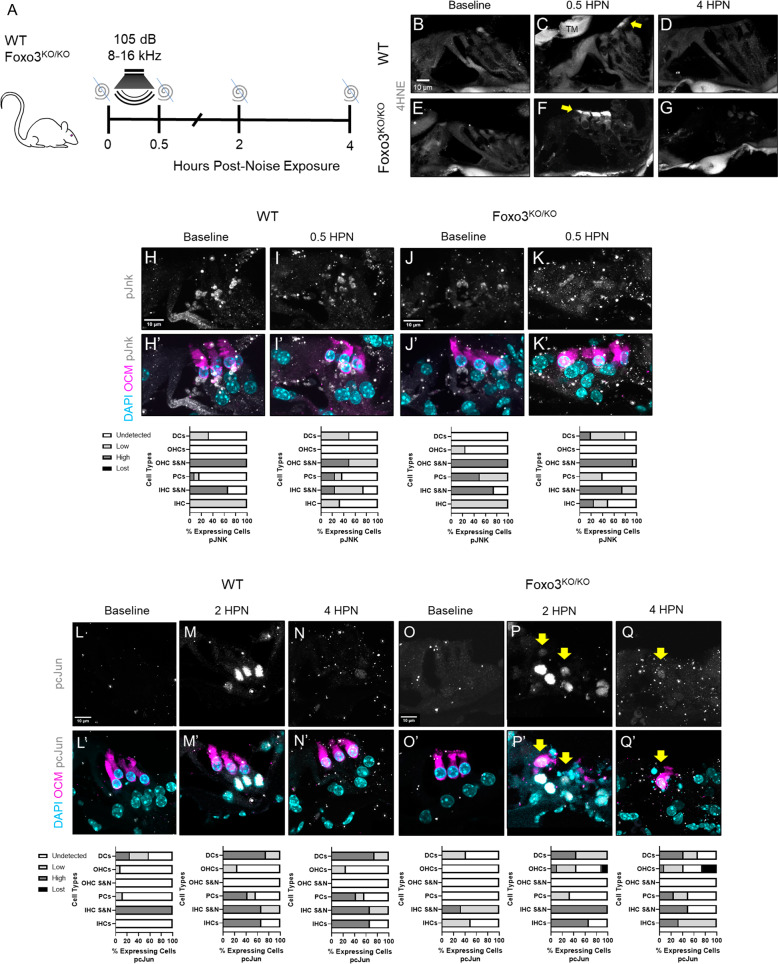
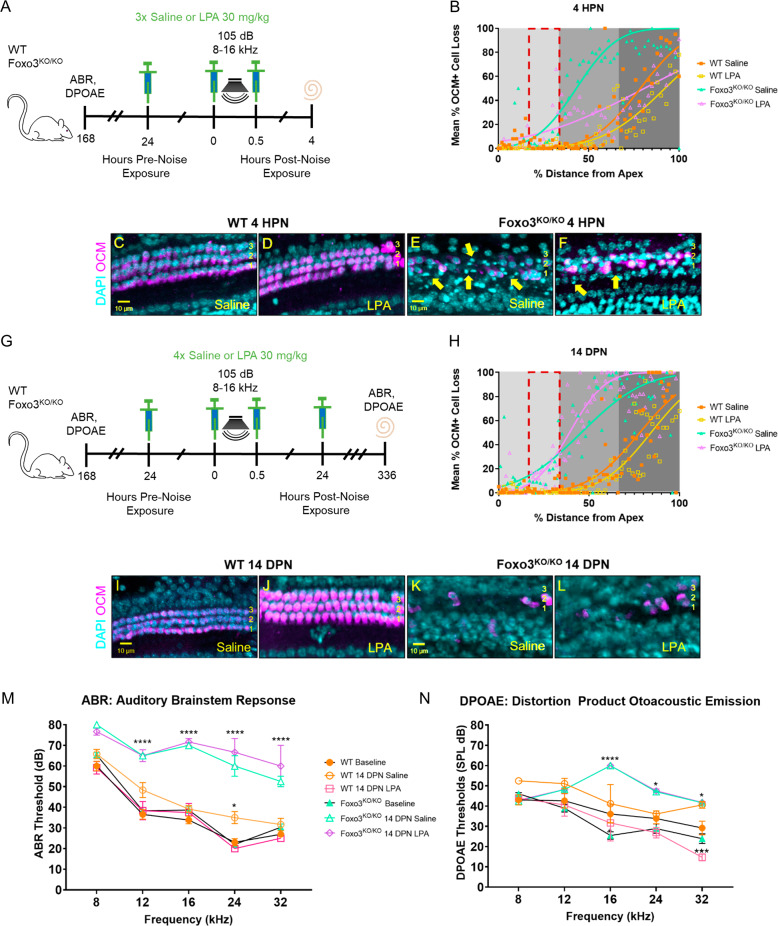
The prevalence of noise-induced hearing loss (NIHL) continues to increase, with limited therapies available for individuals with cochlear damage. We have previously established that the transcription factor FOXO3 is necessary to preserve outer hair cells (OHCs) and hearing thresholds up to two weeks following mild noise exposure in mice. The mechanisms by which FOXO3 preserves cochlear cells and function are unknown. In this study, we analyzed the immediate effects of mild noise exposure on wild-type, Foxo3 heterozygous (Foxo3+/-), and Foxo3 knock-out (Foxo3-/-) mice to better understand FOXO3's role(s) in the mammalian cochlea. We used confocal and multiphoton microscopy to examine well-characterized components of noise-induced damage including calcium regulators, oxidative stress, necrosis, and caspase-dependent and caspase-independent apoptosis. Lower immunoreactivity of the calcium buffer Oncomodulin in Foxo3-/- OHCs correlated with cell loss beginning 4 h post-noise exposure. Using immunohistochemistry, we identified parthanatos as the cell death pathway for OHCs. Oxidative stress response pathways were not significantly altered in FOXO3's absence. We used RNA sequencing to identify and RT-qPCR to confirm differentially expressed genes. We further investigated a gene downregulated in the unexposed Foxo3-/- mice that may contribute to OHC noise susceptibility. Glycerophosphodiester phosphodiesterase domain containing 3 (GDPD3), a possible endogenous source of lysophosphatidic acid (LPA), has not previously been described in the cochlea. As LPA reduces OHC loss after severe noise exposure, we treated noise-exposed Foxo3-/- mice with exogenous LPA. LPA treatment delayed immediate damage to OHCs but was insufficient to ultimately prevent their death or prevent hearing loss. These results suggest that FOXO3 acts prior to acoustic insult to maintain cochlear resilience, possibly through sustaining endogenous LPA levels.


Conflict of interest statement

The authors declare no competing interests.

Figures

Fig. 1
Fig. 1. OCM modulation observed immediately following noise exposure.
A Noise exposure method for WT, Foxo3+/−, and Foxo3−/− mice. Cochleae were extracted for whole-mount immunohistochemistry immediately following the exposure (0.5 h post-noise exposure or HPN), at 4 HPN, or 24 HPN. Unexposed littermates served as baseline controls. BE Expression of MYO7 (white) was maintained in the Foxo3−/− OHCs following noise exposure (yellow arrows). B′–E′ Over the same time course, OCM (pink) immunoreactivity decreased in OHCs, mainly in rows 2 and 3. n = 3, scale bar = 10 µm, ×20 magnification, ~24 kHz region. FI Cochleograms of % mean OCM+ cell loss (y-axis) plotted against % distance from the cochlear apex (x-axis). Each dot represents the mean number of OCM+ cells counted in 100 µM intervals along the length of cochleae (4–86 kHz) pooled (n = 3–6 per genotype/condition). Cochlear tonotopic regions are presented by background color: Apex = light gray, Middle = gray, Base = dark gray. Non-parametric interpolation lines are presented for each group: WT (orange), Foxo3+/− (pink), and Foxo3−/− (green). GI The noise band is presented as a red dotted outline. Kruskal–Wallis rank-sum test adjusted for multiple comparisons, alpha = 0.05, *p < 0.05, **p < 0.01, ***p < 0.001, ****p < 0.0001.
Fig. 2
Fig. 2. Loss of OCM immunoreactivity precedes apoptosis in Foxo3−/− OHCs.
After immunostaining in whole-mount, the 24 kHz cochlear region was mapped, imaged using confocal microscopy at ×150 magnification, and rendered in Imaris (n = 3 cochleae per genotype/condition). AH The rendered images of OHCs colored cyan for DAPI+ cell nuclei. A’–H’ Renderings of DAPI+/OCM + OHCs with OCM in magenta. A″–H″ Renderings of DAPI+/OCM+/CytC+ cells with CytC in gray. Scale bar = 10 µm. AC″ Little to no change in OCM and CytC localization through 4 HPN in WT OHCs. DD″ By 24 HPN, WT OHCs only expressing CytC+ (yellow arrows) are in the minority of cells likely damaged by the noise exposure. F′, F″ At 0.5 HPN, a large number of Foxo3−/− OHCs lose OCM immunoreactivity (yellow arrows). G, G″ By 4 HPN, several OHC regions with low OCM contain pyknotic or missing nuclei (yellow arrows). H′, H″ Only two OCM+/CytC+ OHCs remain in any of the standard three rows (white arrows); the other nuclei belong to SCs as they exist in a lower z-plane and have a larger mean diameter. IK OHC counts for all three genotypes expressing specific fluorophores (y-axis) are graphed versus the noise exposure timeline (x-axis). I Numbers of DAPI + OHC nuclei (y-axis) present across the time course (x-axis); supporting cell nuclei unable to be excluded in the renderings due to thresholding limitations were omitted. J Counts of OHCs as calculated by totaling OCM+/CytC+ cells (y-axis). K Counts of OHCs only expressing CytC (y-axis). WT (black circles, orange mean bar), Foxo3+/− (gray squares, pink mean bar), and Foxo3−/− (light gray triangles, green mean bar) total cell counts per 1024 × 400 × 20-pixel selection. n = 3 per genotype/condition, two-way ANOVA with Tukey’s test for multiple comparisons, alpha = 0.05, *p < 0.05, **p < 0.01, ***p < 0.001, ****p < 0.0001.
Fig. 3
Fig. 3. Foxo3−/− OHCs do not initiate caspase-dependent apoptosis but may activate parthanatos pathways after mild noise exposure.
AD′ Multiphoton images of the middle, ~24 kHz region, in whole-mounted cochleae over the established time course. Tissues were analyzed for OCM (magenta) and CASP3 (cyan). D′ Inset = positive control tissue: CASP3 + apoptotic SGNs after chronic cigarette smoke exposure. n = 3–5 per time point, ×20 magnification, scale bar = 50 μm. EH‴ Single-matched optical sections from confocal images of 24 kHz OHCs under baseline conditions and 0.5 HPN. WT (EF‴) and Foxo3−/− (GH‴) cochleae were sectioned and immunostained for detection of DAPI (cyan, EH), OCM (magenta, E′–H′), and AIFM1 (white, E″–H″). HH‴ The mitochondrial protein AIFM1, localized to the nucleus in the Foxo3−/− OCM-low OHC (yellow arrow), an indication of parthanatos. n = 4 per genotype/condition, ×200 magnification, scale bar = 5 μm.
Fig. 4
Fig. 4. RNA sequencing revealed calcium signaling and the oxidative stress response as active pathways following noise exposure.
A Foxo3−/− and WT mice were subjected to noise and had their cochleae removed for mRNA extraction at 0, 4, and 24 HPN (n = 6 pooled cochleae per genotype/condition). B Top canonical pathways in Foxo3−/− versus WT cochleae at 4 HPN using Ingenuity Gene Ontology. The p-value indicates the statistical significance of the overlapping genes within the canonical pathway. C Gene expression clustering was performed for the Foxo3−/− versus WT at 4 HPN to produce 8 clusters with similarly behaving genes. Clustering traces and the detailed gene table are available in Supplements (Fig. S6, Table S3). DF Volcano plots of differentially expressed genes at baseline (D), 4 HPN (E), and 24 HPN (F). The y-axis represents −log10(p-value) and x-axis is the log2fold-change. Significantly differentiated genes (−log10(p-value) ≥ 2) are denoted by pink dots above the gray line. Non-significant genes are represented by black dots. Cyan lines divide genes that fall between a −1 to 1 log fold-change.
Fig. 5
Fig. 5. The oxidative stress response in the Foxo3−/− is comparable to WT littermates following noise exposure.
A WT and Foxo3−/− mice were exposed to noise and their cochleae were extracted for cryosectioning and immunohistochemistry at designated time points. BG Cochlear sections of the 24 kHz region immunostained for 4HNE (white) at baseline, 0.5 HPN, and 4 HPN. C, F At 0.5 HPN, 4HNE expression increased at the OHC stereocilia in both genotypes (yellow arrows). D, G 4HNE levels returned to baseline by 4 HPN. n = 3–4 per genotype/time point, 60x magnification, scale bar = 10 µm, TM = Tectorial membrane. HQ′ Cochlear sections of the 24 kHz OHCs and SCs stained for DAPI (cyan) and with antibodies against OCM (magenta), pJnk (HK′, white) and pcJun (LQ′, white). n = 3–5 per genotype/condition, ×200 magnification, scale bar = 10 µm. Corresponding % fluorescent cellular expression graphs below each set of images: undetected = white, low = light gray, high = gray, and lost cells = black, DC Deiters’ cells, OHCs outer hair cells, OHC S&N: OHC synapses and neurites, PCs pillar cells, IHC S&N IHC synapses and neurites, and IHC inner hair cells. HK′ Though strong at the hair cell synapses and highly variable across the organ of Corti, pJnk was absent from the OHCs in both genotypes after noise exposure. In both genotypes, pcJun expression was variable in DC nuclei at baseline (LL′, OO′) but strongly increased by 2 HPN (MM′, PP′). pcJun was present in damaged Foxo3−/− OHC nuclei at 2 HPN (P, P′), continuing through 4 HPN (QQ′) (yellow arrows).
Fig. 6
Fig. 6. Activation of the Rho pathway with lysophosphatidic acid (LPA) delays OHC loss from noise in the Foxo3−/− but does not improve hearing recovery.
A, G All mice were tested for baseline ABRs and DPOAEs the week prior to noise exposure. A One set of WT and Foxo3−/− mice (n = 3–5 per genotype) received three i.p. injections of LPA and were sacrificed at 4 HPN. Sham mice (n = 3–4 per genotype) received three 0.9% sterile saline injections at the same time points. Cochleae were extracted and stained for DAPI and with antibodies against OCM, and MYO7 for OHC quantification. B Cochleogram at 4 HPN of % mean OCM+ cell loss (y-axis) plotted against % distance from the cochlear apex (x-axis). Each dot represents the mean number of OCM+ cells counted in 100 µM intervals along the length of cochleae (4–86 kHz) pooled (n = 3 per genotype/condition). Non-parametric interpolation lines are presented with each group: WT Saline (orange squares), WT LPA (gold squares), Foxo3−/− Saline (green triangles), and Foxo3−/− LPA (purple triangles). Cochlear tonotopic regions are presented by background color: Apex = light gray, Middle = gray, Base = dark gray. The noise band is presented as a red dotted outline. Mann–Whitney U and Kruskal–Wallis rank-sum test adjusted for multiple comparisons, p < 0.05. CF Confocal images of 24 kHz OHC regions of each genotype/condition at 4 HPN immunostained with DAPI (cyan) and OCM (magenta). E, F Foxo3−/− saline-treated OCM-low OHCs contained more pyknotic nuclei overall than the Foxo3−/− LPA-treated OHCs (yellow arrows). n = 3 per genotype/condition, ×20 magnification, scale bar = 10 µm. G A second set of mice (n = 3 per genotype) was injected four times with LPA and sacrificed at 336 h (14 DPN) following hearing tests. Sham mice (n = 3 per genotype) received four saline injections at the same time points and underwent the same tests. H Cochleogram at 14 DPN with the same parameters as in B. IL Confocal images at 14 DPN with the same parameters as in CF. K, L OCM + OHC immunoreactivity in both Foxo3−/− groups was similar. Mean ABR (M) and DPOAE (N) thresholds (y-axis) at baseline for WT (n = 16, orange circles) and Foxo3−/− (n = 14, green triangles) groups, and at 14 DPN for WT Saline (n = 3, orange open circles), WT LPA (n = 3, pink open squares), Foxo3−/− Saline (n = 3, green open triangles), and Foxo3−/− LPA (n = 3, purple open diamonds) groups are plotted along five frequencies tested (x-axis). ±s.e.m., two-way ANOVA with Tukey’s test for multiple comparisons, Welch’s t-test, alpha = 0.05, *p < 0.05, **p < 0.01, ***p < 0.001, ****p < 0.0001.

Similar articles

Cited by

References

    1. Carroll YI, Eichwald J, Scinicariello F, Hoffman HJ, Deitchman S, Radke MS, et al. Vital signs: noise-induced hearing loss among adults—United States 2011–2012. Morb Mortal Wkly Rep. 2017;66:139–44. doi: 10.15585/mmwr.mm6605e3. - DOI - PMC - PubMed
    1. White PM. Genetic susceptibility to hearing loss from noise exposure. Hear J. 2019;72:8–9. doi: 10.1097/01.HJ.0000602896.08600.65. - DOI
    1. Guo H, Ding E, Bai Y, Zhang H, Shen H, Wang J, et al. Association of genetic variations in FOXO3 gene with susceptibility to noise induced hearing loss in a Chinese population. PLoS ONE. 2017;12:e0189186. doi: 10.1371/journal.pone.0189186. - DOI - PMC - PubMed
    1. Deng A, Ma L, Zhou X, Wang X, Wang S, Chen X. FoxO3 transcription factor promotes autophagy after oxidative stress injury in HT22 cells. Can J Physiol Pharmacol. 2020;99:1–8. - PubMed
    1. Tsuji T, Maeda Y, Kita K, Murakami K, Saya H, Takemura H, et al. FOXO3 is a latent tumor suppressor for FOXO3-positive and cytoplasmic-type gastric cancer cells. Oncogene. 2021;40:3072–86. doi: 10.1038/s41388-021-01757-x. - DOI - PMC - PubMed

Publication types

MeSH terms

Substances