Microglia enable mature perineuronal nets disassembly upon anesthetic ketamine exposure or 60-Hz light entrainment in the healthy brain
- PMID: 34233180
- PMCID: PMC8284881
- DOI: 10.1016/j.celrep.2021.109313
Microglia enable mature perineuronal nets disassembly upon anesthetic ketamine exposure or 60-Hz light entrainment in the healthy brain
Abstract
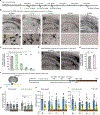
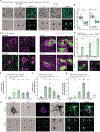
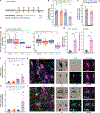
Perineuronal nets (PNNs), components of the extracellular matrix, preferentially coat parvalbumin-positive interneurons and constrain critical-period plasticity in the adult cerebral cortex. Current strategies to remove PNN are long-lasting, invasive, and trigger neuropsychiatric symptoms. Here, we apply repeated anesthetic ketamine as a method with minimal behavioral effect. We find that this paradigm strongly reduces PNN coating in the healthy adult brain and promotes juvenile-like plasticity. Microglia are critically involved in PNN loss because they engage with parvalbumin-positive neurons in their defined cortical layer. We identify external 60-Hz light-flickering entrainment to recapitulate microglia-mediated PNN removal. Importantly, 40-Hz frequency, which is known to remove amyloid plaques, does not induce PNN loss, suggesting microglia might functionally tune to distinct brain frequencies. Thus, our 60-Hz light-entrainment strategy provides an alternative form of PNN intervention in the healthy adult brain.
Keywords: 60-Hz; anesthesia; ketamine; light entrainment; microglia; ocular dominance plasticity; perineuronal net.
Copyright © 2021 The Author(s). Published by Elsevier Inc. All rights reserved.
Conflict of interest statement
Declaration of interests The authors declare no competing interests. A.V. and S.S. disclose an international patent application (PCT/EP2020/079365).
Figures


Similar articles
-
Minimally invasive protocols and quantification for microglia-mediated perineuronal net disassembly in mouse brain.STAR Protoc. 2021 Dec 11;2(4):101012. doi: 10.1016/j.xpro.2021.101012. eCollection 2021 Dec 17. STAR Protoc. 2021. PMID: 34950889 Free PMC article.
-
Chondroitinase and Antidepressants Promote Plasticity by Releasing TRKB from Dephosphorylating Control of PTPσ in Parvalbumin Neurons.J Neurosci. 2021 Feb 3;41(5):972-980. doi: 10.1523/JNEUROSCI.2228-20.2020. Epub 2020 Dec 8. J Neurosci. 2021. PMID: 33293360 Free PMC article.
-
Removal of Perineuronal Nets Unlocks Juvenile Plasticity Through Network Mechanisms of Decreased Inhibition and Increased Gamma Activity.J Neurosci. 2017 Feb 1;37(5):1269-1283. doi: 10.1523/JNEUROSCI.2504-16.2016. Epub 2016 Dec 30. J Neurosci. 2017. PMID: 28039374 Free PMC article.
-
Perineuronal nets in brain physiology and disease.Semin Cell Dev Biol. 2019 May;89:125-135. doi: 10.1016/j.semcdb.2018.09.011. Epub 2018 Oct 9. Semin Cell Dev Biol. 2019. PMID: 30273653 Review.
-
Perineuronal Nets: Plasticity, Protection, and Therapeutic Potential.Trends Neurosci. 2019 Jul;42(7):458-470. doi: 10.1016/j.tins.2019.04.003. Epub 2019 Jun 4. Trends Neurosci. 2019. PMID: 31174916 Review.
Cited by
-
A tool for mapping microglial morphology, morphOMICs, reveals brain-region and sex-dependent phenotypes.Nat Neurosci. 2022 Oct;25(10):1379-1393. doi: 10.1038/s41593-022-01167-6. Epub 2022 Sep 30. Nat Neurosci. 2022. PMID: 36180790 Free PMC article.
-
Leveraging neural plasticity for the treatment of amblyopia.Surv Ophthalmol. 2024 Sep-Oct;69(5):818-832. doi: 10.1016/j.survophthal.2024.04.006. Epub 2024 May 18. Surv Ophthalmol. 2024. PMID: 38763223 Review.
-
Chondroitin sulfate glycan sulfation patterns influence histochemical labeling of perineuronal nets: a comparative study of interregional distribution in human and mouse brain.bioRxiv [Preprint]. 2024 Jun 21:2024.02.09.579711. doi: 10.1101/2024.02.09.579711. bioRxiv. 2024. Update in: Glycobiology. 2024 Jun 22;34(8):cwae049. doi: 10.1093/glycob/cwae049. PMID: 38948769 Free PMC article. Updated. Preprint.
-
How Stress Influences the Dynamic Plasticity of the Brain's Extracellular Matrix.Front Cell Neurosci. 2022 Jan 25;15:814287. doi: 10.3389/fncel.2021.814287. eCollection 2021. Front Cell Neurosci. 2022. PMID: 35145379 Free PMC article. Review.
-
Retrosplenial cortex microglia and perineuronal net densities are associated with memory impairment in aged rhesus macaques.Cereb Cortex. 2023 Apr 4;33(8):4626-4644. doi: 10.1093/cercor/bhac366. Cereb Cortex. 2023. PMID: 36169578 Free PMC article.
References
-
- Bates D, Mächler M, Bolker B, and Walker S (2015). Fitting Linear Mixed-Effects Models Using lme4 | Bates | Journal of Statistical Software. J. Stat. Softw.
-
- Bauer J, Sminia T, Wouterlood FG, and Dijkstra CD (1994). Phagocytic activity of macrophages and microglial cells during the course of acute and chronic relapsing experimental autoimmune encephalomyelitis. J. Neurosci. Res. - PubMed
Publication types
MeSH terms
Substances
Grants and funding
LinkOut - more resources
Full Text Sources
Other Literature Sources
Molecular Biology Databases

