. 2021 Nov;15(11):3125-3146.
doi: 10.1002/1878-0261.13053. Epub 2021 Jul 22.

LAMC1 upregulation via TGFβ induces inflammatory cancer-associated fibroblasts in esophageal squamous cell carcinoma via NF-κB-CXCL1-STAT3

Affiliations

LAMC1 upregulation via TGFβ induces inflammatory cancer-associated fibroblasts in esophageal squamous cell carcinoma via NF-κB-CXCL1-STAT3

Lingling Fang et al. Mol Oncol. 2021 Nov.

Abstract

Cancer-associated fibroblasts (CAF) are a heterogeneous cell population within the tumor microenvironment,and play an important role in tumor development. By regulating the heterogeneity of CAF, transforming growth factor β (TGFβ) influences tumor development. Here, we explored oncogenes regulated by TGFβ1 that are also involved in signaling pathways and interactions within the tumor microenvironment. We analyzed sequencing data of The Cancer Genome Atlas (TCGA) and our own previously established RNA microarray data (GSE53625), as well as esophageal squamous cell carcinoma (ESCC) cell lines with or without TGFβ1 stimulation. We then focused on laminin subunit gamma 1 (LAMC1), which was overexpressed in ESCC cells, affecting patient prognosis, which could be upregulated by TGFβ1 through the synergistic activation of SMAD family member 4 (SMAD4) and SP1. LAMC1 directly promoted the proliferation and migration of tumor cells, mainly via Akt-NFκB-MMP9/14 signaling. Additionally, LAMC1 promoted CXCL1 secretion, which stimulated the formation of inflammatory CAF (iCAF) through CXCR2-pSTAT3. Inflammatory CAF promoted tumor progression. In summary, we identified the dual mechanism by which the upregulation of LAMC1 by TGFβ in tumor cells not only promotes ESCC proliferation and migration, but also indirectly induces carcinogenesis by stimulating CXCL1 secretion to promote the formation of iCAF. This finding suggests that LAMC1 could be a potential therapeutic target and prognostic marker for ESCC.

Keywords: CAF; CXCL1; ESCC; LAMC1; heterogeneity; transforming growth factor β.


Conflict of interest statement

The authors declare no conflict of interest.

Figures
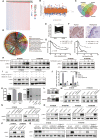
Fig. 1
Fig. 1
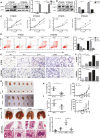
Laminin subunit gamma 1 (LAMC1) expression was upregulated by transforming growth factor β (TGFβ1) via SMAD family member 4 (SMAD4) and SP1 synergistic activation and was associated with a poor prognosis in patients with esophageal squamous cell carcinoma (ESCC). (A) Heatmap of the RNA‐seq data listing genes positively correlated with TGFβ1 in ESCC of GSE53625 (r > 0.15, P < 0.05). (B) A total of 3084 genes of KYSE30 and KYSE180 were upregulated after TGFβ1 treatment using RNA‐seq data (fold change > 1). (C) Venn diagram of 652 overlapping genes based on positive regulation by TGFβ1 in ESCC. (D) The 31 genes of 652 genes were enriched in 11 pathways involved in the tumor microenvironment. (E,F) LAMC1 was more highly expressed in cancer than in para‐cancer at the RNA and protein levels. Representative immunohistochemical (IHC) images of LAMC1 staining in ESCC tumor tissues and nontumor tissues (original magnification: 200x). (G) Kaplan–Meier survival analysis of OS based on high (n = 89) and low (n = 90) LAMC1 expression in GSE53625 (left) and based on high (n = 35) and low (n = 20) LAMC1 expression (by IHC, right). (H,I) As verified by western blot and RT‐qPCR, TGFβ1 upregulated LAMC1 expression in a concentration‐ (at different concentrations for 24 h) and time‐dependent manner (at 5 ng·mL−1 for different times) in KYSE30 and KYSE450 cells (H), which could be reversed by the TGFβR1 inhibitor SB505124 (10 μm) at the protein (I) and RNA (J) levels. (K,L) After KYSE30 cells were treated with TGFβ1 (5 ng·mL−1) for 30 min, the localization of SMAD4 or SP1 to the LAMC1 promoter was detected by ChIP, and the expression of SMAD4 or SP1 was detected in anti‐SP1 or anti‐SMAD4 chromatin fractions separately by western blot (L). (M,N) Knockdown efficiency of SP1 combined with or without SMAD4 knockdown in ESCC cells was verified by western blotting. (O–Q) The expression levels of LAMC1 decreased in ESCC cells with SP1 knockdown combined with (P) or without (O) knockdown, but this effect could not be rescued by TGFβ1 treatment (Q). Three biological replicates were performed for in vitro assays. The data in bar charts are presented as the mean ± SD. **P < 0.01, ***P < 0.001, ****P < 0.0001 (Student’s t‐test).
Fig. 2
Fig. 2
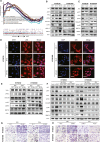
LAMC1 promoted the proliferation and metastasis of ESCC cells in vivo and in vitro. (A,B) Knockdown or overexpression efficiency of LAMC1 in ESCC cells was verified by western blot and RT‐qPCR. (C) The rate of cell growth of KYSE30 and KYSE450 cells treated with shLAMC1 or overexpressing LAMC1 and vector control cells was measured by CCK‐8 assay. (D) Apoptosis of shLAMC1‐1, ‐2 and sh‐vec KYSE30 and KYSE450 cells was analyzed using the Annexin V APC Apoptosis Detection Kit. (E,F) The migration ability of shLAMC1‐1, ‐2, sh‐vec, LAMC1 and vector KYSE30 and KYSE450 cells was detected by chamber assay. The numbers of migrating cells were compared between the groups. (G–J) Representative images of tumor formation in nude mice subcutaneously inoculated with KYSE30 cells stably expressing LAMC1 shRNA or negative control and expressing LAMC1 or mock‐vehicle control (G, I), and tumor weights and volumes for groups (H, J). (K,L) Representative images of lung tissues isolated from mice injected with 1 × 106 shLAMC1, sh‐vec, LAMC1 or vector KYSE30 cells via the tail vein and hematoxylin and eosin stained images (200×) of such tissues, and quantification of lung metastasis (scale bars: 1 mm and 200 µm for the top and bottom rows of photomicrographs, respectively). Three biological replicates were performed for in vitro assays. The data in bar charts are presented as the mean ± SD. *P < 0.05, **P < 0.01, ***P < 0.001, ****P < 0.0001 (Student’s t‐test).
Fig. 3
Fig. 3
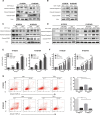
The positive effect of LAMC1 on ESCC cell migration occurred mainly via the Akt/IKKα/NF‐Κb/MMP9/14 pathway. (A) Antiapoptosis, NF‐κB and cytokine‐related pathways enriched by sh‐vec using GSEA. (B,C) Expression levels of phosphorylated Akt, NF‐κB, IKKα, MMP9 and MMP14 in KYSE30 and KYSE450 cells stably expressing LAMC1 shRNA or negative control and expressing LAMC1 or mock‐vehicle control. (D) Immunofluorescence staining of p65 in shLAMC1‐1, shLAMC1‐2, sh‐vec KYSE30 and KYSE450 cells. Nuclei were visualized with DAPI staining (blue). Representative images are shown. Scale bar: 34 μm. (E,F) Phosphorylation of IKKα, p65, MMP9 and MMP14 was also detected in shLAMC1 KYSE30 and KYSE450 cells treated with or without TNFα stimulation (E), and overexpressing LAMC1 with or without 5 μm Akt phosphorylation selective inhibitor MK‐2206 2HCI and 10 μm NF‐κB JSH‐23 stimulation (F). (G,H) Representative images of migration of these subgroups, shLAMC1 with or without TNFα (10 ng·mL−1) stimulation, overexpression of LAMC1 with or without JSH‐23 stimulation, measured by chamber assay. Three biological replicates were performed for in vitro assays.
Fig. 4
Fig. 4
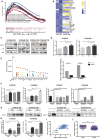
LAMC1 inhibited apoptosis possibly through the Akt/NF‐κB/caspase9‐caspase3‐PARP cascade. (A,B) Western blotting was conducted to detect the protein levels of cleaved caspase‐3, caspase‐9, and PARP in KYSE30 and KYSE450 cells stably expressing LAMC1 shRNA or negative control and expressing LAMC1 or mock‐vehicle control, which were induced by 10 µm cisplatin for 24 h. (C,D) After cisplatin induction (10 mm for 24 h), cleaved caspase‐3, caspase‐9 and PARP were detected in KYSE30 and KYSE450 cells treated with shLAMC1 with or without TNFα stimulation (C) or overexpressing LAMC1 with or without 5 μm Akt phosphorylation selective inhibitor MK‐2206 2HCI and 10 μm NF‐κB nuclear translocation inhibitor JSH‐23 stimulation (D). (E–G) Proliferation and apoptosis of KYSE30 and KYSE450 cells stably expressing LAMC1 shRNA or negative control and expressing LAMC1 or mock‐vehicle control with or without TNFα or JSH‐38 (JSH), as measured by a CCK8 assay. Three biological replicates were performed for in vitro assays. The data in bar charts are presented as the mean ± SD. *P < 0.05, **P < 0.01, ***P < 0.001, ****P < 0.0001 (Student’s t‐test).
Fig. 5
Fig. 5
LAMC1 promoted CXCL1 secretion mainly by activating NF‐κB. (A) LAMC1 affected the cytokine and chemokine signaling pathways according to GSE53625 data. (B) A 48‐cytokine panel was used to detect cytokines in the CM of shLAMC1 and sh‐vec KYSE450 cells. (C) Expression of three cytokines in the CM of KYSE30 and KYSE450 cells stably expressing LAMC1 shRNA or negative control and expressing LAMC1 or mock‐vehicle control by western blot. (D) CXCL1 expression in the CM of shLAMC1 and LAMC1‐overexpressing KYSE30 and KYSE450 cells, as measured by ELISA. (E) Top 20 predicted transcription factors of CXCL1 in the Cistome network. (F,G) ELISA (F) and western blotting (G) were conducted to detect CXCL1 expression in the CM of shLAMC1 and sh‐vec cells with or without TNFα treatment, and of LAMC1‐overexpressing cells with or without 5 μm Akt phosphorylation selective inhibitor MK‐2206 2HCI and 10 μm NF‐κB nuclear translocation inhibitor JSH‐23 stimulation. (H) RT‐qPCR was conducted to detect CXCL1 expression in shLAMC1 and sh‐vec cells with or without TNFα treatment. (I) LAMC1 was positively associated with CXCL1 based on GSE53625 data. (J) CXCL1 was upregulated in tumor tissue compared with that in adjunct tissue in the GSE53625 dataset. Three biological replicates were performed for in vitro assays. The data in bar charts are presented as the mean ± SD. *P < 0.05, **P < 0.01, ***P < 0.001, ****P < 0.0001 (Student’s t‐test).
Fig. 6
Fig. 6
Tumor‐secreted CXCL1 promoted the formation of inflammatory CAF (iCAF). (A) Transcriptional profile of CAF with or without treatment with recombinant CXCL1 (rCXCL1) and sh‐vec conditioned medium (CM). (B,C) rCXCL1 or sh‐vec CM promoted activation of cytokine and chemokine pathways and phosphorylation of STAT3, as demonstrated by GSEA. (D–I) Western blot and RT‐qPCR detection of markers of iCAF and myofibroblasts (myCAF), respectively, in CM of CAF cocultured with shLAMC1 or sh‐vec ESCC cells (D,E), treated with the CM of shLAMC1 or sh‐vec ESCC cells (F,G), or treated with rCXCL1 (H,I). Three biological replicates were performed for in vitro assays. The data in bar charts are presented as the mean ± SD. *P < 0.05, **P < 0.01, ***P < 0.001, ****P < 0.0001 (Student’s t‐test).
Fig. 7
Fig. 7
CXCL1 induced inflammatory CAF formation via phosphorylation of STAT3. (A‐C) Expression of pSTAT3 and CXCR2 was detected in CAF with three different treatments: induced with rCXCL1 (A), cocultured with shLAMC1 and sh‐vec KYSE30 cells (B) or stimulated by CM from these tumor cells (C), as demonstrated by western blot. (D–I) IL1β, IL6 and CSF3 were detected by western blot and RT‐qPCR in concentrated CM of CAF with three treatments with or without the CXCR2 inhibitor SB225002 (D,E,G,H,J,K), and αSMA, pSTAT3 and CXCR2 were detected in the total protein of cells (F,I,L). Three biological replicates were performed for in vitro assays. The data in bar charts are presented as the mean ± SD. *P < 0.05, **P < 0.01, ***P < 0.001, ****P < 0.0001 (Student’s t‐test).
Fig. 8
Fig. 8
Inflammatory CAF, induced by CXCL1, promoted the proliferation and migration of ESCC in vitro and in vivo. (A) Detection of the viability of WT KYSE30 and KYSE450 cells cocultured for 48 h with or without PBS‐treated CAF, CXCL1‐induced CAF, or with SB225002, as demonstrated by CCK‐8 assay. (B,C) Migration of WT KYSE30 cells with different treatments: with or without CM of CAF that were or were not pre‐induced with rCXCL1 combined with SB225002, as measured by chamber assay. (D,E) Comparison of tumor volume and weights of subcutaneous tumor xenografts established from the co‐implantation of KYSE30 cells and CXCL1‐pretreated or not pretreated MRC‐5 cells in the presence or absence of SB225002 treatment. (F) Representative immunohistochemical (IHC) images of MMP9 staining in xenograft tumor tissue of WT KYSE30 cells admixed with implanted CAF with different pretreatments (original magnification: 200x). (G) Expression of MMP9 in xenograft tumor tissue of WT KYSE30 cells admixed with implanted CAF with different pretreatments was detected by western blot. Three biological replicates were performed for in vitro assays. The data in bar charts are presented as the mean ± SD. *P < 0.05, **P < 0.01, ***P < 0.001, ****P < 0.0001 (Student’s t‐test).

Similar articles

Cited by

References

    1. Lagergren J, Smyth E, Cunningham D & Lagergren P (2017) Oesophageal cancer. Lancet 390, 2383–2396. - PubMed
    1. Abnet CC, Arnold M & Wei WQ (2018) Epidemiology of esophageal squamous cell carcinoma. Gastroenterology 154, 360–373. - PMC - PubMed
    1. Lin EW, Karakasheva TA, Hicks PD, Bass AJ & Rustgi AK (2016) The tumor microenvironment in esophageal cancer. Oncogene 35, 5337–5349. - PMC - PubMed
    1. Nagarsheth N, Wicha MS & Zou W (2017) Chemokines in the cancer microenvironment and their relevance in cancer immunotherapy. Nat Rev Immunol 17, 559–572. - PMC - PubMed
    1. Wang W, Kryczek I, Dostal L, Lin H, Tan L, Zhao L, Lu F, Wei S, Maj T, Peng D et al. (2016) Effector T cells abrogate stroma‐mediated chemoresistance in ovarian cancer. Cell 165, 1092–1105. - PMC - PubMed

Publication types

MeSH terms