. 2021 Nov;164(3):569-586.
doi: 10.1111/imm.13389. Epub 2021 Jul 14.

Interleukin-35 is a critical regulator of immunity during helminth infections associated with multiple sclerosis

Affiliations

Interleukin-35 is a critical regulator of immunity during helminth infections associated with multiple sclerosis

Jorge Correale et al. Immunology. 2021 Nov.

Abstract

Multiple sclerosis (MS) is currently thought to arise by interactions between genetic susceptibility and environmental factors. Infections in general trigger autoimmune responses causing clinical manifestations of disease. However, as a result of regulatory T (Treg)- and regulatory B (Breg)-cell induction, helminth infections tend to dampen disease activity. IL-35, the newest member of the IL-12 family, is an inhibitory cytokine composed of an EBI3β chain subunit, and an IL-12p35 subunit. The aim of this study was to investigate the role of IL-35 during parasite infections occurring in individuals with MS. Numbers of IL-35-producing Breg cells are higher in CSF from helminth-infected than from uninfected MS subjects, a finding associated with decreased MRI disease activity. Interestingly, stimulation of CD19+ B cells with IL-35 promotes conversion of these cells to Breg cells producing both IL-35 and IL-10. Coculture of B cells from helminth-infected MS patients inhibits proliferation of Th1 and Th17 myelin peptide-specific T cells, as well as production of IFN-γ and IL-17. Following activation, CD4+ CD25+ Treg cells significantly upregulate expression of EBI3 and IL-12p35 mRNA. Furthermore, CD4+ CD25- T cells activated in the presence of IL-35 induce a population of cells with regulatory function, known as iTR35. Finally, B cells from normal individuals cultured in vitro in the presence of the helminth antigen SEA increase expression of the transcription BATF, IRF4 and IRF8, acquiring a pattern similar to that of IL-35 Breg cells. These data highlight the important immunoregulatory effects of IL-35 on both Breg and Treg cells, observed in helminth-infected MS subjects.

Keywords: EAE; IL-10; IL-35; helminths; multiple sclerosis; regulatory B cells; regulatory T cells.


Conflict of interest statement

The authors declare no competing interests in reference to this manuscript.

Figures

FIGURE 1
FIGURE 1
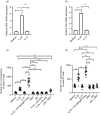
(a,b) CD19+ B cells isolated from helminth‐infected patients produce higher amounts of IL‐10 and IL‐35, compared with uninfected MS patients and control subjects. Antihelminth treatment was associated with significant decrease in production of both cytokines. One hundred and thousand cells per well were stimulated with irradiated Ltk‐11 cells transfected with CD40L, at a Ltk‐cell‐to‐B‐cell ratio of 1:10, plus anti‐CD40 mAb (1 µg/ml). Cytokines were measured in culture supernatants using ELISA. Each circle represents average cytokine production from three different wells. (c) IL‐35‐producing B‐cell number was assessed in CSF using ELISPOT assays. Specific numbers were calculated by subtracting the number of spots obtained in non‐stimulated control cultures, from the number of spots obtained in cultures stimulated with either CD40, or through sequential BCR engagement followed by CD40 signalling. Data shown correspond to number of spots per 105 B cells, in CSF from 12 infected and 12 uninfected MS patients. (d) Increased number of IL‐35‐producing B cells in CSF from helminth‐infected patients was accompanied by lower combined unique active (CUA) MRI lesion scores. CUA was calculated by adding new or enlarging T2 lesions, to previous gadolinium‐enhancing lesions. (e) CUA MRI lesion scores from 12 helminth‐infected MS patients were compared with number of IL‐35+ Breg cells. Regression analysis showed a statistically significant inverse correlation between the variables. **P < 0·01, ***P < 0·001 and ****P < 0·0001. §P = 0·0005
FIGURE 2
FIGURE 2
(a‐b) CD19+ B cells from MS patients were isolated from PBMC using magnetic isolation kits, cultured in medium either alone or in the presence of IL‐35 or IL‐27. EBI3 and IL‐12p35 were then measured using RT‐PCR. For mRNA expression, data were normalized to the amount of GAPDH, as control housekeeping gene. Inter‐ and intra‐assay variations examined in five separate experiment runs were 5% and 7%, respectively. Data represent mean ± SEM from 12 MS patients. (c‐d) Isolated CD19+ B cells were stimulated with irradiated Ltk‐11 cells and transfected with CD40L in the presence of anti‐CD40 mAb in medium containing IL‐35, IL‐27, EBI3, p35, IL‐35 plus anti‐human IgG and IgM, or EBI3 plus p35. Number of cytokine‐producing B cells were then assessed using ELISPOT assays. Each circle represents values for an individual MS patient. Specific number of cytokine‐producing cells was calculated as described in Figure 1C. Data correspond to number of spots per 105 B cells from 16 patients. **P < 0·01, ***P < 0·001 and ****P < 0·0001
FIGURE 3
FIGURE 3
(a‐b) Magnetic cell‐sorted CD19+ B cells from helminth‐infected MS patients, and control subjects inhibited both proliferative response of Th1 and Th17 autologous MBP and MOG peptide‐reactive T‐cell lines induced by cognate antigens, as well as (c‐d) IFN‐γ and IL‐17 production. To this end, Th1‐ and Th17‐polarized T‐cell lines derived from helminth‐infected MS patients, and healthy controls were cocultured with autologous irradiated PBMCs as APCs, and stimulated with cognate peptide, in the presence and in the absence of autologous CD19+ B cells, previously stimulated for 48 h with Ltk‐11 cells plus anti‐CD40 mAb, (1:1 ratio). Inhibitory effects were abrogated by anti‐IL‐10 and IL‐35 monoclonal antibodies added at the beginning of coculture, at optimal concentrations of 20 µg/ml. Data represent mean ± SEM from seven separate experiments. **P < 0·01, ***P < 0·001 and ****P < 0·0001
FIGURE 4
FIGURE 4
(a‐d) In contrast to what was observed in Figure 3, CD19+ B cells isolated from uninfected MS patients did not exhibit suppressive activity. Th1 and Th17‐polarized T‐cell lines were stimulated as described in Figure 3. IL‐35 (50 ng/ml) added at the beginning of the coculture transformed CD19+ B cells into cells capable of inhibiting Th1 and Th17 cell activity, similar to what was observed with CD19+ B cells derived from helminth‐infected MS patients. Data represent mean ± SEM from seven separate experiments. **P < 0·01 and ***P < 0·001
FIGURE 5
FIGURE 5
(a) CD4+CD25+ Treg cells were sorted from PBMC derived from uninfected MS patients, and stimulated with anti‐CD3/anti‐CD28 mAb (both at 5 µg/ml) and 100 IU rhIL‐2. After 7‐day activation, mRNA encoding different single chains IL‐12 family member subunits were assessed using RT‐PCR, as previously described. EBI3 and IL‐12p35 mRNA expressions were significantly upregulated. Expression of mRNA encoding other IL‐12 family members (IL‐23(p19), IL‐27(p28) and IL‐12(p40) was not upregulated in Treg cells isolated from helminth‐infected MS patients. Results represent mean ± SEM from seven experiments. (b‐c) Production of IL‐10 and IL‐35 by CD4+CD25+ Treg cells, sorted from PBMC from helminth‐infected MS patients, uninfected MS patients and control subjects after stimulation, is shown. (d) Production of IL‐35 by induced Treg cells (iTreg35) isolated from helminth‐infected MS patients, uninfected MS subjects and healthy control is shown. In panels b, c and d, each circle represents mean values of triplicate cultures from an individual subject. ****P < 0·0001
FIGURE 6
FIGURE 6
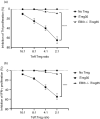
(a‐b) Titratable mean percentage inhibition by iTreg35 cells of proliferative response and IFN‐γ production, on autologous T effector CD4+CD25 MBP83‐102 peptide‐specific cells, in response to stimulation with the cognate antigen. Both inhibitory effects were abolished by silencing EBI3 gene in iTreg35 cells using siRNA technique. Percentage of iTreg35 cell inhibition was defined as: [1‐Treg/Teff values ÷ Teff values] x 100. ****P < 0·0001
FIGURE 7
FIGURE 7
(a‐d) iTreg35 cells from helminth‐infected MS patients and healthy controls, but not from uninfected MS subjects, inhibited proliferative response of autologous Th1 and Th17 MBP83‐102 peptide‐specific cells after cognate antigen stimulation, as well as IFN‐γ and IL‐17 production. Induced Treg cells in which EBI3 was silenced using siRNA, and addition of anti‐IL‐35 mAb, failed to inhibit either effect. Data represent mean values ±SEM of seven separate experiments. ***P < 0·001 ****P < 0·0001
FIGURE 8
FIGURE 8
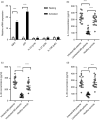
CD19+ B cells from normal individuals were isolated from PBMC and cultured for 3 days, in medium with 20 µg/ml SEA and without (control). IL‐35, IL‐6 and TNF‐α levels were assayed in culture supernatants using ELISA. (a) SEA‐stimulated B cells secreted significantly more IL‐35, but not IL‐6 or TNF‐α. (b) IL‐35‐producing B‐cell number measured using ELISPOT assay also increased after SEA treatment. This number was calculated by subtracting the numbers of spots obtained in non‐stimulated background control cultures, from number of spots obtained in stimulated cultures. (c) Specific immunoreactivity of CD40 and CD86 was measured by flow cytometry, and results are expressed as mean fluorescence intensity (MFI), an indicator of specific molecule density per cell. (d) SEA‐activated CD19+ B cells expressed significantly greater levels of CD1d, compared with B cells cultured in medium without SEA. Expression of both MHC Class I CD1d, and MHC Class I CD1c was assessed by flow cytometry and is expressed as MFI. (e) CD19+ B cells activated in vitro were also capable of driving Treg cell development. One hundred and thousand SEA‐activated CD19+ B cells were cocultured with an equal number of autologous CD4+CD25 T cells isolated from PBMC and stimulated with suboptimal concentrations of anti‐CD3 and anti‐CD28 monoclonal antibodies (1 µg/ml each). After 4 days, CD4+CD25+Foxp3+ Treg cell number was determined by flow cytometry. The highest CD4+CD25+Foxp3+ Treg cell count was observed when CD4+CD25 T cells were cocultured with SEA‐activated B cells. In the same experiments, the receptor of IL‐35 was blocked by adding anti IL12Rβ and anti‐gp130 monoclonal antibodies (10 µg/ml each) at culture onset. (f) After coculture with medium or SEA‐treated B cells, Treg cells were isolated using a CD4+CD25+ regulatory T‐cell isolation kit, and the number of IL‐35‐producing Treg cells was quantified by ELISPOT as previously described. (g‐i) Isolated CD19+ B cells were activated with SEA as previously described, and IRF4, IRF8 and BATF mRNA expressions were analysed using RT‐PCR. Data were normalized to amount of GAPDH, as control housekeeping gene. For panels g‐i, data represent mean values ±SEM of five separate experiments. ***P < 0·001 and ****P < 0·0001
FIGURE 9
FIGURE 9
Th1 MBP83‐102‐specific T cells were stimulated with the cognate peptide (10 µg/ml) in the presence of autologous CD19+ B cells previously cultured in medium with or without SEA (Tef/B‐cell ratio 1:1). (a) SEA‐activated CD19+ B cells significantly inhibited the proliferative response and (b) production of IFN‐γ. After silencing EBI3 using a siRNA technique, Breg cells failed to inhibit T‐cell proliferation or IFN‐γ production. In addition, inhibitory effects mediated by SEA‐activated CD19+ B cells were abrogated by anti‐MHC Class I CD1d mAb. Data represent mean ± SEM of seven separate experiments. ***P < 0·001

Similar articles

Cited by

References

    1. Thompson AJ, Baranzini SE, Geurts J, Hemmer B, Ciccarelli O. Multiple sclerosis. Lancet. 2018;391:1622–36. - PubMed
    1. Gourraud PA, Harbo HF, Hauser SL, Baranzini SE. The genetics of multiple sclerosis: an up‐to‐date review. Immunol Rev. 2012;248:87–103. - PMC - PubMed
    1. Ascherio A. Environmental factors in multiple sclerosis. Expert Rev Neurother. 2013;13(12 Suppl):3–9. - PubMed
    1. Correale J, Fiol M, Gilmore W. The risk of relapses in multiple sclerosis during systemic infections. Neurology. 2006;67:652–9. - PubMed
    1. Kivity S, Agmon‐Levin N, Blank M, Shoenfeld Y. Infections and autoimmunity–friends or foes? Trends Immunol. 2009;30:409–14. - PubMed

Publication types

MeSH terms