

Increased levels of mitochondrial import factor Mia40 prevent the aggregation of polyQ proteins in the cytosol
- PMID: 34191328
- PMCID: PMC8365258
- DOI: 10.15252/embj.2021107913
Increased levels of mitochondrial import factor Mia40 prevent the aggregation of polyQ proteins in the cytosol
Abstract
The formation of protein aggregates is a hallmark of neurodegenerative diseases. Observations on patient samples and model systems demonstrated links between aggregate formation and declining mitochondrial functionality, but causalities remain unclear. We used Saccharomyces cerevisiae to analyze how mitochondrial processes regulate the behavior of aggregation-prone polyQ protein derived from human huntingtin. Expression of Q97-GFP rapidly led to insoluble cytosolic aggregates and cell death. Although aggregation impaired mitochondrial respiration only slightly, it considerably interfered with the import of mitochondrial precursor proteins. Mutants in the import component Mia40 were hypersensitive to Q97-GFP, whereas Mia40 overexpression strongly suppressed the formation of toxic Q97-GFP aggregates both in yeast and in human cells. Based on these observations, we propose that the post-translational import of mitochondrial precursor proteins into mitochondria competes with aggregation-prone cytosolic proteins for chaperones and proteasome capacity. Mia40 regulates this competition as it has a rate-limiting role in mitochondrial protein import. Therefore, Mia40 is a dynamic regulator in mitochondrial biogenesis that can be exploited to stabilize cytosolic proteostasis.
Keywords: Mia40; huntingtin; mitochondria; protein aggregation; protein translocation.
© 2021 The Authors. Published under the terms of the CC BY 4.0 license.
Conflict of interest statement
The authors declare that they have no conflict of interest.
Figures

Schematic representation of the structure of the Q25‐GFP and Q97‐GFP model proteins used in this study. The sequence consists of a FLAG‐tag (turquois) followed by the polyQ domain from huntingtin exon1 (orange) and eGFP.
Q25‐GFP and Q97‐GFP were expressed in wild‐type cells for 18 h before cells were visualized by widefield fluorescence microscopy. Cells harboring an empty vector (ev) are shown for control. Cell boundaries are indicated by dashed lines. Bars, 5 µm.
Wild‐type cells expressing the indicated proteins under control of a galactose‐inducible GAL1 promoter were grown in glucose medium to mid‐log phase before tenfold serial dilutions were dropped on plates containing glucose or galactose.
Wild‐type (WT) cells were shifted from glucose to galactose. Then, mRNA levels of Q97‐GFP were measured by qPCR. Shown are normalized mean values and standard deviations from three replicates.
Cells were lysed with SDS‐containing sample buffer before proteins were visualized by Western blotting. Insoluble aggregates migrate at the top of the gel between stacker and resolving gel. Tim17 served as loading control.
Microscopic images of the Q97‐GFP fluorescence. Bars, 5 µm.
The percentage of cells containing or lacking detectable aggregates was quantified. Cell boundaries are indicated by dashed lines.

- A
Mitochondria were visualized by mitochondrially targeted mCherry (red) in WT cells expressing Q97‐GFP for 4 h. Fluorescence micrographs are maximum intensity projections of z stacks subjected to deconvolution. Bar, 5 µm.
- B, C
The polyQ proteins were expressed for the indicated time periods. Mitochondria were isolated from wild‐type strains containing the Q25/97‐GFP‐expressing plasmids and from cells lacking mitochondrial DNA (rho0 ). The ability of these mitochondria to respire (shown as NADH‐induced oxygen consumption) or their activity of cytochrome c oxidase (shown as their capacity to oxidize reduced cytochrome c) was measured.
- D
Cells of the temperature‐sensitive mia40‐3 mutant (Chacinska et al, 2004) or the corresponding wild type were transformed with plasmids expressing the indicated proteins from a low‐expression GALL promoter (Mason et al, 2013) and grown on the respective carbon sources at permissive conditions (25°C).
- E
Q97‐GFP was expressed in mia40‐3 and corresponding wild‐type cells for the times indicated. Cells were harvested and washed, and survivors were counted after plating on glucose plates. Mean values and standard deviations of three replicates are shown.

Indicated strains were grown on glucose medium before tenfold serial dilutions were dropped on glucose‐ or galactose‐containing plates.
Cell extracts were analyzed by Western blotting after shifting cultures to galactose for 16 h. 25, Q25‐GFP; 97, Q97‐GFP; and ev, empty vector.
Microscopy images of the indicated strains 12 h after shifting them to galactose. Note that in GAL‐Mia40 cells the form and number of aggregates is very different to WT cells. Bar, 5 µm.
The patterns of the Q97‐GFP distribution were quantified after different time of expression, n = 100. Cell boundaries are indicated by dashed lines.
PolyQ proteins were expressed for 24 h before survivors were counted. Mean values and standard deviations from three independent experiments are shown.
The GAL‐Mia40 strain was much more resistant to Q97‐GFP expression than WT cells, indicating that high Mia40 levels can suppress polyQ toxicity.

Cells were grown to mid‐log phase in glucose‐containing medium, shifted to galactose‐containing medium for 4 h, and analyzed by 3D fluorescence microscopy. Fluorescence micrographs are z stacks subjected to deconvolution. DIC, differential interference microscopy. Bar, 5 µm.
Cells were grown to mid‐log phase in medium containing glycerol (3%) and ethanol (2%) as carbon sources, shifted to galactose‐containing medium for 4 h, and analyzed by 3D fluorescence microscopy. Fluorescence micrographs are maximum intensity projections of z stacks. Asterisks indicate representative cells exhibiting interconnected, “curly” mitochondria. Bar, 5 µm.
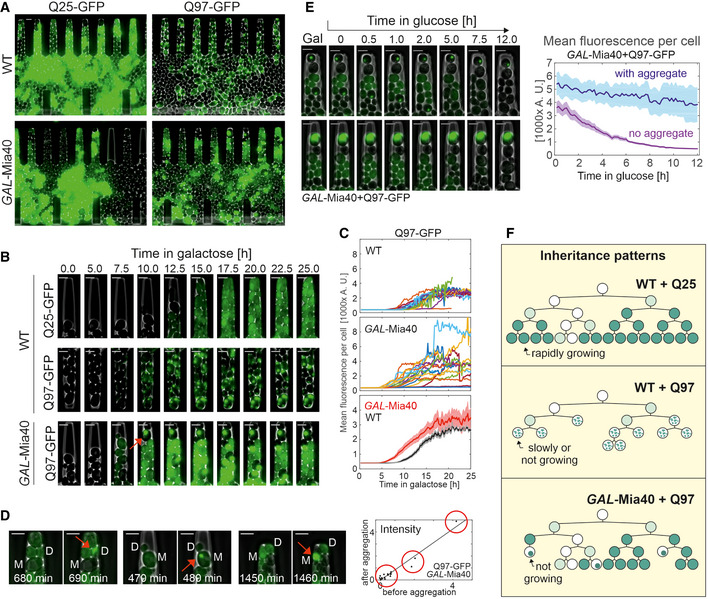
Cells were grown in microfluidic chambers (see Movies [Link], [Link], [Link], [Link]). To better visualize the fluorescence signals, different intensity settings were used, so that the intensities here are not comparable. Bars, 4 µm.
Still frames after different times of growth indicate a uniform fluorescence in Q25‐GFP‐expressing cells. Q97‐GFP expression in wild type leads to many small and scattered aggregates per cell. In GAL‐Mia40 cells, Q97‐GFP accumulates to much larger intensities but then suddenly collapses into one single aggregate per cell. The arrow depicts aggregate formation. Bars, 4 µm.
Quantified signal intensities in cells of the indicated mutants. In top and middle graphs, each curve corresponds to a single cell. Averaged signals (mean + SEM) in bottom graph (N = 20 for WT and N = 17 cells for GAL‐Mia40).
Still frames directly before and after the Q97‐GFP aggregate formation in GAL‐Mia40 cells. Total cellular fluorescence intensity before aggregation and total intensity in the aggregate (red arrow) were quantified and are shown in the graph on the right hand side, indicating that the entire cellular fluorescent signal collapses into the one single aggregate, irrespective of whether cells contain little, high, or very high amounts of GFP signal (groups indicated by three red circles on the quantification). M, mother and D, daughter. Bars, 4 µm.
Cells were shifted from galactose to glucose to stop expression of Q97‐GFP. The quantified image shows mean values and SEM from 20 cells with aggregates and 15 cells without aggregate, indicating that soluble Q97‐GFP is degraded whereas the aggregated protein is of much higher stability. Bars, 4 µm.
Schematic inheritance patterns of polyQ proteins in wild‐type and GAL‐Mia40 cells. Compare also Fig EV2 for more details.

An automated detection algorithm was established that was trained by use of 154 original grayscale images of growing yeast cells for which each cell had been outlined by hand by visual inspection. Machine learning optimized cell detection before the patterns of fluorescence were again detected manually in a training set from which the algorithm learned to distinguish five different classes of patterns.
Examples of these automatically detected classes of cells are shown in which the five categories are indicated by different colors. The number of cells in each category is shown here for different yeast strains as indicated. Bars, 4 µm.
- A
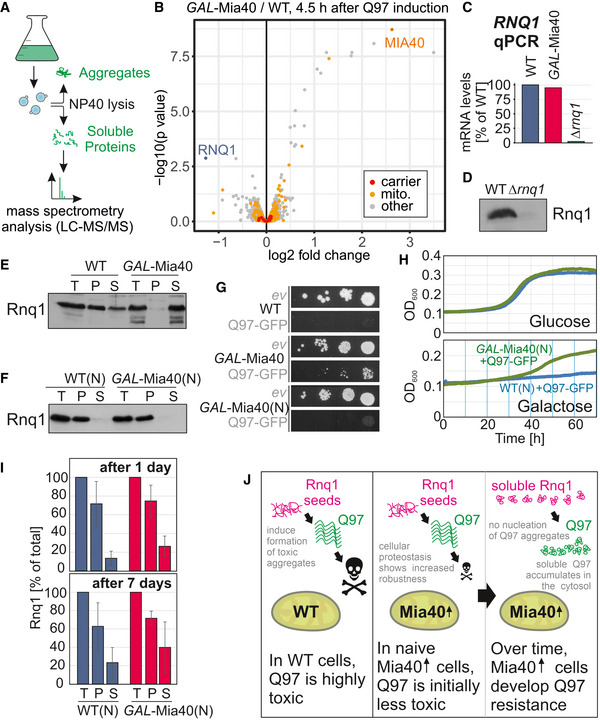
Workflow of the quantification of soluble proteins by mass spectrometry.
- B
Q97‐GFP was expressed for 4.5 h in wild‐type and GAL‐Mia40 cells in two biological replicates each. Cells were lysed with NP‐40 before soluble proteins were quantified. Mitochondrial proteins (mito.) and members of the mitochondrial carrier family (carrier) are visualized in a volcano plot. P‐values were derived from a moderated t‐test. Mitochondrial (mito.) and carrier proteins are indicated by yellow and red dots, respectively. Rnq1 is indicated in blue.
- C
Transcript levels for RNQ1 were measured by qPCR in the strains indicated.
- D
Antibodies against Rnq1 were used in Western blots to specifically detect the protein in whole cell extracts of yeast cells.
- E, F
Cell extracts of the strains indicated were separated into soluble (S) and aggregated (P) fractions. Rnq1 was detected by Western blotting. Whole cell extracts (total, T) were loaded for control. The wild‐type and GAL‐Mia40(N) strains shown in F were newly generated.
- G
Drop dilution experiments of the strains indicated on galactose plates; ev, empty vector.
- H
Growth curves of the indicated strains at 30°C.
- I
Cells of the newly made strains were grown on galactose for 1 or 7 days, respectively. Cells were lysed before the distribution of Rnq1 in the soluble and pellet fractions was quantified. Shown are mean values and standard deviations of three independent replicates.
- J
Mia40 overexpression reduces the toxicity of polyQ proteins. In newly made cells, Q97‐GFP is still toxic (though less than in wild type) but after several generations, cells escape sensitivity by loss of Rnq1 nucleation seeds.

Drop dilution experiment of the indicated strains.
Cells of the indicated strains were grown in galactose medium overnight. Cells were lysed and either directly loaded to the gel (T, total) or separated into pellet (P) and supernatant (S) fractions by centrifugation. The indicated proteins were detected by Western blotting.
Wild‐type cells containing the Q97‐GFP expression or empty plasmids were radiolabeled for 3 min with 35S‐methionine before labeling was quenched by addition of excess amounts of non‐radioactive methionine. At the time points indicated, proteins were precipitated with trichloroacetic acid before the alkylating agent methyl‐polyethylene glycol (24)‐maleimide (mmPEG24) was added which shifts the size by about 2 kDa per free reduced thiol group. For control, tris(2‐carboxyethyl) phosphine (TCEP) was added to reduce all disulfide bonds.
Wild‐type cells carrying the Δura3 marker allele were transformed with plasmids for the expression of Oxa1‐Ura3, Δ5‐Oxa1‐Ura3 (lacking the N‐terminal five residues), or ΔN‐Oxa1‐Ura3 (lacking the entire 42 residues of the mitochondrial targeting sequence of Oxa1). Serial dilutions were dropped on plates containing or lacking uracil.
The three indicated proteins were expressed in wild‐type cells. Please note that Q97‐GFPnF expression does not lead to a detectable fluorescent signal. Cell boundaries are indicated by dashed lines.
- A
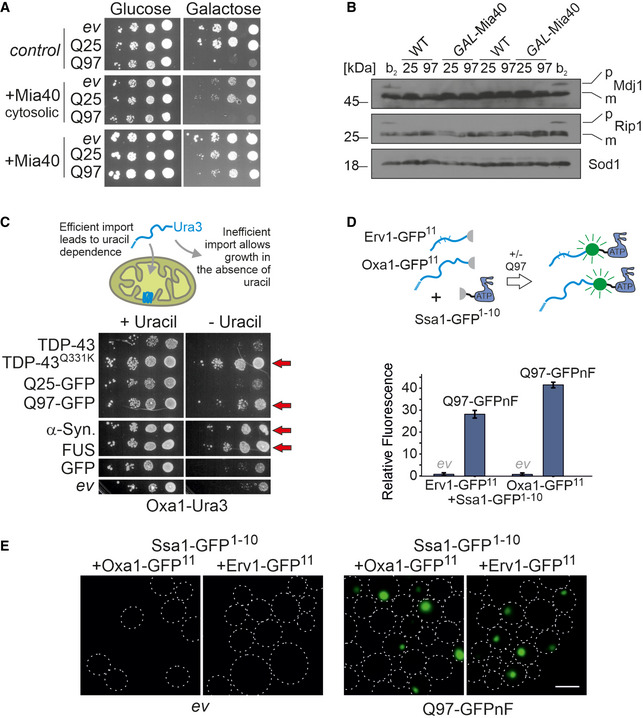
Wild‐type and GAL‐Mia40 cells, and cells expressing a cytosolic version of Mia40 under GAL1 control were dropped on the indicated plates; ev, empty vector. Note that the mitochondrial version of Mia40 suppressed polyQ toxicity, whereas the cytosolic version did not.
- B
In wild‐type or GAL‐Mia40 cells, Q25‐GFP or Q97‐GFP was expressed for 4.5 h. For control, wild‐type cells were used which expressed also for 4.5 h the “clogger” protein cytochrome b2‐DHFR, a strong competitive inhibitor of protein import. Samples were analyzed by Western blotting. The presence of precursor proteins (labeled as P) in addition to the mature forms (labeled as m) is indicative of a strong import defect.
- C
Δura3 cells expressing the Oxa1‐Ura3 reporter for the cytosolic accumulation of mitochondrial precursor proteins (Hansen et al, 2018) were transformed with plasmids expressing the proteins TDP‐43, the TDP‐43Q331K mutant, Q25‐GFP, Q97‐GFP, α‐synuclein, FUS, or GFP from a constitutive glyceraldehyde‐3‐phosphate dehydrogenase (GPD) promoter. Note that the expression of all aggregation‐prone proteins (indicated by red arrows) allows cells to grow on uracil‐deficient plates indicating the cytosolic accumulation of the Oxa1‐Ura3 fusion protein.
- D, E
Wild‐type cells were transformed with plasmids for the expression of the indicated proteins. Q97‐GFPnF is a non‐fluorescent version of Q97‐GFP. Close proximity of the two split‐GFP parts results in fluorescence which was quantified in a spectrometer and visualized by microscopy. Shown are mean values and standard deviations of three replicates. Bar, 5 µm.
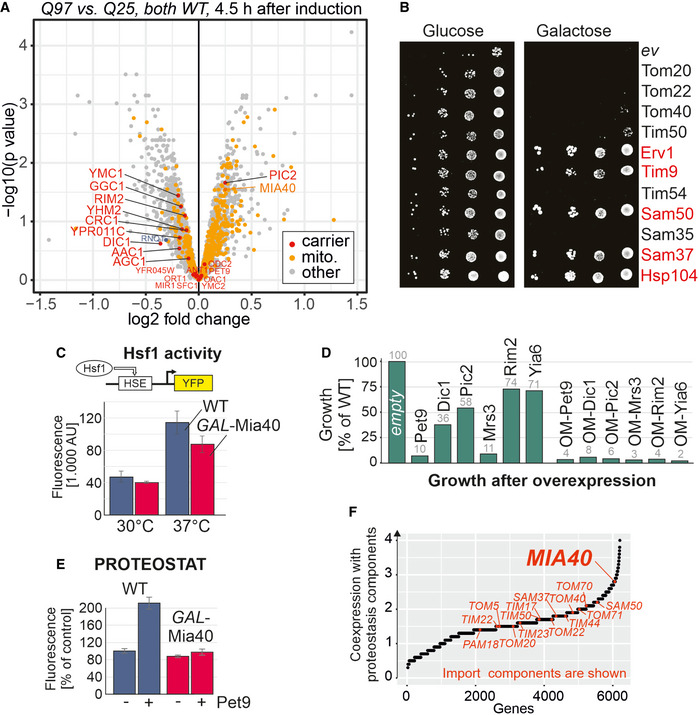
Q25‐GFP and Q97‐GFP were expressed in wild‐type cells for 4.5 h. Cell extracts were subjected to mass spectrometry‐based proteomics. The levels of Mia40 and other mitochondrial proteins (mito., yellow) and carrier proteins (orange) are visualized in a volcano plot (P‐values were derived using a moderated t‐test). The position of Rnq1 is indicated in blue.
The open reading frames of the indicated proteins were cloned downstream of a GAL promoter in plasmids and transformed into cells harboring the Q97‐GFP expression plasmid. Cells harboring an empty vector (ev) were used for control. Cells were shifted to galactose medium overnight before they were dropped onto glucose or galactose plates. If cells are directly dropped from lactate medium onto galactose plates, only individual cells (indicated by red protein names) escaped the polyQ toxicity (see Fig EV4C).
Wild‐type and GAL‐Mia40 cells were transformed with plasmids that express yellow fluorescent protein (YFP) under the control of a minimal promoter containing the Hsf1‐driven heat shock element (HSE). Cells were grown at 30 or 37°C before fluorescence was measured. Mean values and standard deviations of three replicates are shown.
Cells expressing the indicated carrier proteins from GAL promoters were dropped onto galactose plates. Cell growth was quantified by densitometry from one representative plate. OM refers to carrier proteins that were expressed as fusions with an N‐terminal outer membrane anchor. See Fig EV4 D and E for scans of the respective plates.
The formation of protein aggregates was detected with a PROTEOSTAT protein aggregation assay. The expression of the most abundant mitochondrial carrier protein, Pet9, resulted in a strongly increased fluorescence in wild‐type cells but not in GAL‐Mia40 cells. Mean values and standard deviations of three replicates are shown.
Using the SPELL data collection of transcription data sets, we calculated the co‐expression of yeast genes with genes relevant for proteostasis (chaperones, proteasome, and others; see Materials and Methods for details). Genes for mitochondrial import components are highlighted.

- A, B
The respective yeast strains were analyzed by a drop dilution experiment and fluorescence microscopy. Please note that the absence of Hsp104 suppresses the formation of toxic polyQ aggregates. Cell boundaries are indicated by dashed lines. Bars, 5 µm.
- C
The indicated proteins were co‐expressed with Q97‐GFP. Lactate‐grown precultures were dropped onto glucose and galactose plates. Please note that without pre‐conditioning only individual cells were able to escape polyQ toxicity. Suppressors are indicated by red protein names (cf. Fig 7B). Such escaping cells were only observed if specific proteins were co‐expressed with Q97‐GFP.
- D–F
The indicated strains were grown to mid‐log phase in lactate medium before serial dilutions were dropped on the indicated plates and incubated at 30°C. OM depicts expression of linker proteins with an N‐terminal outer membrane anchor corresponding to the residues 1–36 of Tom70. Gal., galactose and ev, empty vector.
- A
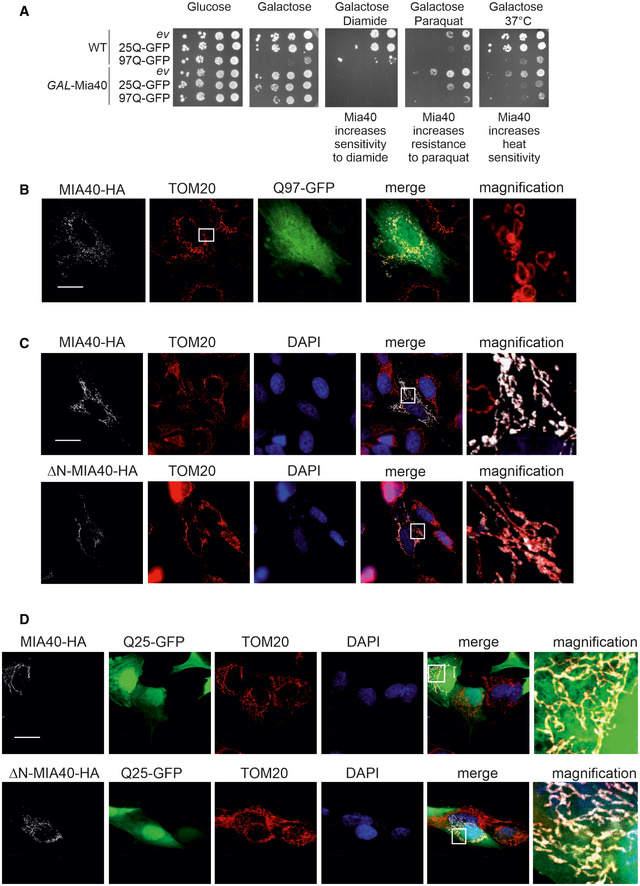
Cells were grown on lactate medium. Tenfold dilutions were dropped on the respective plates and incubated at 30°C (A) or 37°C (B). The concentrations of diamide or paraquat were 0.5 and 1 mM, respectively; ev, empty vector.
- B–D
The expression of MIA40, ΔN‐MIA40, or Q25‐GFP does not affect mitochondrial morphology. SH‐SY5Y cells were analyzed by immunocytochemistry as indicated. TOM20 was used as mitochondrial marker. Whereas MIA40 co‐localizes with TOM20, ΔN‐MIA40 is not efficiently targeted into mitochondria. Bars, 20 µm.

Cell extracts of HEK293 cells expressing a C‐terminally Strep‐tagged version of MIA40 (MIA40‐Strep) or a mock control were analyzed by Western blotting with antibodies against several IMS proteins as well as HSP70 which served as loading control. The enrichment factors shown in green are based on quantitative mass spectrometry data (Habich et al, 2019). P‐values were derived from Student’s t‐test. TCE, trichloroethanol protein stain.
SH‐SY5Y cells co‐expressing Q97‐GFP with MIA40 (middle row), ΔN‐MIA40 (lower row), or a mock‐transfected control (upper row) were analyzed by immunocytochemistry and super‐resolution microscopy. The magnification shows an enlarged section of the TOM20 staining. TOM20 and TRAP1 serve as markers for the mitochondrial outer membrane and the matrix, respectively. Bars, 20 µm. Magnifications: 40‐fold of a 63x objective field.
The percentage of cells with Q97‐GFP aggregates was quantified in control (mock transfected) and MIA40‐expressing cells. Data are displayed as mean ± standard deviations and were analyzed by two‐tailed Student's t‐test, n = 6. *P ≤ 0.05.
SH‐SY5Y cells co‐expressing Q97‐GFP with MIA40 (upper row) or ΔN‐MIA40 (lower row) were analyzed by immunocytochemistry and super‐resolution microscopy. The magnification shows an enlarged section of the TRAP1 staining used as a marker for the mitochondrial matrix, respectively. Bars, 20 µm. Magnifications: 40‐fold of a 63× objective field.
Model for competition of mitochondrial precursor proteins and aggregation‐prone proteins for factors of the quality control (QC) machinery, such as chaperones and components of the proteasome system. Our observations indicate that mitochondrial membrane proteins pose a particular threat to cytosolic proteostasis. Overexpression of the indicated components of the import machinery suppresses the toxicity of polyQ proteins for which the prion protein Rnq1 plays a critical role.
Comment in
-
Suppressing toxic aggregates: let MIA do it!EMBO J. 2021 Aug 16;40(16):e109001. doi: 10.15252/embj.2021109001. Epub 2021 Jul 20. EMBO J. 2021. PMID: 34287997 Free PMC article.
Similar articles
-
Cytosolic Fe-S Cluster Protein Maturation and Iron Regulation Are Independent of the Mitochondrial Erv1/Mia40 Import System.J Biol Chem. 2015 Nov 13;290(46):27829-40. doi: 10.1074/jbc.M115.682179. Epub 2015 Sep 22. J Biol Chem. 2015. PMID: 26396185 Free PMC article.
-
The C-terminal region of the oxidoreductase MIA40 stabilizes its cytosolic precursor during mitochondrial import.BMC Biol. 2020 Aug 6;18(1):96. doi: 10.1186/s12915-020-00824-1. BMC Biol. 2020. PMID: 32762682 Free PMC article.
-
Mitochondrial protein import: Mia40 facilitates Tim22 translocation into the inner membrane of mitochondria.Mol Biol Cell. 2013 Mar;24(5):543-54. doi: 10.1091/mbc.E12-09-0649. Epub 2013 Jan 2. Mol Biol Cell. 2013. PMID: 23283984 Free PMC article.
-
AIF meets the CHCHD4/Mia40-dependent mitochondrial import pathway.Biochim Biophys Acta Mol Basis Dis. 2020 Jun 1;1866(6):165746. doi: 10.1016/j.bbadis.2020.165746. Epub 2020 Feb 24. Biochim Biophys Acta Mol Basis Dis. 2020. PMID: 32105825 Review.
-
CHCHD4 (MIA40) and the mitochondrial disulfide relay system.Biochem Soc Trans. 2021 Feb 26;49(1):17-27. doi: 10.1042/BST20190232. Biochem Soc Trans. 2021. PMID: 33599699 Free PMC article. Review.
Cited by
-
Elimination of virus-like particles reduces protein aggregation and extends replicative lifespan in Saccharomyces cerevisiae.Proc Natl Acad Sci U S A. 2024 Apr 2;121(14):e2313538121. doi: 10.1073/pnas.2313538121. Epub 2024 Mar 25. Proc Natl Acad Sci U S A. 2024. PMID: 38527193 Free PMC article.
-
Cytosolic Quality Control of Mitochondrial Protein Precursors-The Early Stages of the Organelle Biogenesis.Int J Mol Sci. 2021 Dec 21;23(1):7. doi: 10.3390/ijms23010007. Int J Mol Sci. 2021. PMID: 35008433 Free PMC article. Review.
-
The emerging role of autophagy and mitophagy in tauopathies: From pathogenesis to translational implications in Alzheimer's disease.Front Aging Neurosci. 2022 Oct 17;14:1022821. doi: 10.3389/fnagi.2022.1022821. eCollection 2022. Front Aging Neurosci. 2022. PMID: 36325189 Free PMC article. Review.
-
Long-term mitochondrial stress induces early steps of Tau aggregation by increasing reactive oxygen species levels and affecting cellular proteostasis.Mol Biol Cell. 2022 Jul 1;33(8):ar67. doi: 10.1091/mbc.E21-11-0553. Epub 2022 Apr 21. Mol Biol Cell. 2022. PMID: 35446108 Free PMC article.
-
In planta expression of human polyQ-expanded huntingtin fragment reveals mechanisms to prevent disease-related protein aggregation.Nat Aging. 2023 Nov;3(11):1345-1357. doi: 10.1038/s43587-023-00502-1. Epub 2023 Oct 2. Nat Aging. 2023. PMID: 37783816 Free PMC article.
References
-
- Aguilaniu H, Gustafsson L, Rigoulet M, Nystrom T (2003) Asymmetric inheritance of oxidatively damaged proteins during cytokinesis. Science 299: 1751–1753 - PubMed
-
- Boos F, Krämer L, Groh C, Jung F, Haberkant P, Stein F, Wollweber F, Gackstatter A, Zoller E, van der Laan M et al (2019) Mitochondrial protein‐induced stress triggers a global adaptive transcriptional programme. Nat Cell Biol 21: 442–451 - PubMed
Publication types
MeSH terms
Substances
LinkOut - more resources
Full Text Sources
Molecular Biology Databases
Research Materials
