Construction and Validation of a Macrophage-Associated Risk Model for Predicting the Prognosis of Osteosarcoma
- PMID: 34188683
- PMCID: PMC8192206
- DOI: 10.1155/2021/9967954
Construction and Validation of a Macrophage-Associated Risk Model for Predicting the Prognosis of Osteosarcoma
Abstract
Background: Osteosarcoma is one of the most common bone tumors among children. Tumor-associated macrophages have been found to interact with tumor cells, secreting a variety of cytokines about tumor growth, metastasis, and prognosis. This study aimed to identify macrophage-associated genes (MAGs) signatures to predict the prognosis of osteosarcoma.
Methods: Totally 384 MAGs were collected from GSEA software C7: immunologic signature gene sets. Differential gene expression (DGE) analysis was performed between normal bone samples and osteosarcoma samples in GSE99671. Kaplan-Meier survival analysis was performed to identify prognostic MAGs in TARGET-OS. Decision curve analysis (DCA), nomogram, receiver operating characteristic (ROC), and survival curve analysis were further used to assess our risk model. All genes from TARGET-OS were used for gene set enrichment analysis (GSEA). Immune infiltration of osteosarcoma sample was calculated using CIBERSORT and ESTIMATE packages. The independent test data set GSE21257 from gene expression omnibus (GEO) was used to validate our risk model.
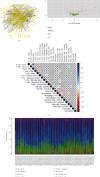
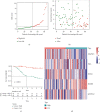
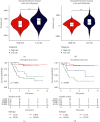
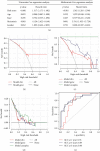
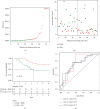
Results: 5 MAGs (MAP3K5, PML, WDR1, BAMBI, and GNPDA2) were screened based on protein-protein interaction (PPI), DGE, and survival analysis. A novel macrophage-associated risk model was constructed to predict a risk score based on multivariate Cox regression analysis. The high-risk group showed a worse prognosis of osteosarcoma (p < 0.001) while the low-risk group had higher immune and stromal scores. The risk score was identified as an independent prognostic factor for osteosarcoma. MAGs model for diagnosis of osteosarcoma had a better net clinical benefit based on DCA. The nomogram and ROC curve also effectively predicted the prognosis of osteosarcoma. Besides, the validation result was consistent with the result of TARGET-OS.
Conclusions: A novel macrophage-associated risk score to differentiate low- and high-risk groups of osteosarcoma was constructed based on integrative bioinformatics analysis. Macrophages might affect the prognosis of osteosarcoma through macrophage differentiation pathways and bring novel sights for the progression and prognosis of osteosarcoma.
Copyright © 2021 Kang-Wen Xiao et al.
Conflict of interest statement
The authors declare that there are no conflicts of interest.
Figures




Similar articles
-
Prognostic Signature in Osteosarcoma Based on Amino Acid Metabolism-Associated Genes.Cancer Biother Radiopharm. 2024 Sep;39(7):517-531. doi: 10.1089/cbr.2024.0002. Epub 2024 Mar 21. Cancer Biother Radiopharm. 2024. PMID: 38512709
-
Construction of a novel mRNA-signature prediction model for prognosis of bladder cancer based on a statistical analysis.BMC Cancer. 2021 Jul 27;21(1):858. doi: 10.1186/s12885-021-08611-z. BMC Cancer. 2021. PMID: 34315402 Free PMC article.
-
Identification and verification of a BMPs-related gene signature for osteosarcoma prognosis prediction.BMC Cancer. 2023 Feb 22;23(1):181. doi: 10.1186/s12885-023-10660-5. BMC Cancer. 2023. PMID: 36814224 Free PMC article.
-
Signature constructed by glycolysis-immune-related genes can predict the prognosis of osteosarcoma patients.Invest New Drugs. 2022 Aug;40(4):818-830. doi: 10.1007/s10637-022-01228-4. Epub 2022 Apr 18. Invest New Drugs. 2022. PMID: 35435626 Review.
-
PODN is a prognostic biomarker and correlated with immune infiltrates in osteosarcoma.Cancer Cell Int. 2021 Jul 17;21(1):381. doi: 10.1186/s12935-021-02086-5. Cancer Cell Int. 2021. PMID: 34273970 Free PMC article. Review.
Cited by
-
Clinical significance and immune landscape of a novel ferroptosis-related prognosis signature in osteosarcoma.BMC Cancer. 2023 Mar 10;23(1):229. doi: 10.1186/s12885-023-10688-7. BMC Cancer. 2023. PMID: 36899330 Free PMC article.
-
Outstanding prognostic value of novel ferroptosis-related genes in chemoresistance osteosarcoma patients.Sci Rep. 2022 Mar 23;12(1):5029. doi: 10.1038/s41598-022-09080-5. Sci Rep. 2022. PMID: 35322804 Free PMC article.
-
Construction and validation of an oxidative-stress-related risk model for predicting the prognosis of osteosarcoma.Aging (Albany NY). 2023 Jun 2;15(11):4820-4843. doi: 10.18632/aging.204764. Epub 2023 Jun 2. Aging (Albany NY). 2023. PMID: 37285835 Free PMC article.
-
Metastatic Progression of Osteosarcomas: A Review of Current Knowledge of Environmental versus Oncogenic Drivers.Cancers (Basel). 2022 Jan 12;14(2):360. doi: 10.3390/cancers14020360. Cancers (Basel). 2022. PMID: 35053522 Free PMC article. Review.
-
The immune cell infiltration-associated molecular subtypes and gene signature predict prognosis for osteosarcoma patients.Sci Rep. 2024 Mar 2;14(1):5184. doi: 10.1038/s41598-024-55890-0. Sci Rep. 2024. PMID: 38431660 Free PMC article.
References
LinkOut - more resources
Full Text Sources
Miscellaneous

