. 2021 Jun;11(6):e484.
doi: 10.1002/ctm2.484.

Activated neutrophils polarize protumorigenic interleukin-17A-producing T helper subsets through TNF-α-B7-H2-dependent pathway in human gastric cancer

Affiliations

Activated neutrophils polarize protumorigenic interleukin-17A-producing T helper subsets through TNF-α-B7-H2-dependent pathway in human gastric cancer

Zhi-Guo Shan et al. Clin Transl Med. 2021 Jun.

Abstract

Rationale: Neutrophils constitute massive cellular constituents in inflammatory human gastric cancer (GC) tissues, but their roles in pathogenesis of inflammatory T helper (Th) subsets are still unknown.

Methods: Flow cytometry analysis and immunohistochemistry were used to analyze the responses and phenotypes of neutrophils in different samples from 51 patients with GC. Kaplan-Meier plots and Multivariate analysis for the survival of patients were used by log-rank tests and Cox proportional hazards models. Neutrophils and CD4+ T cells were purified and cultured for ex vivo, in vitro and in vivo regulation and function assays.

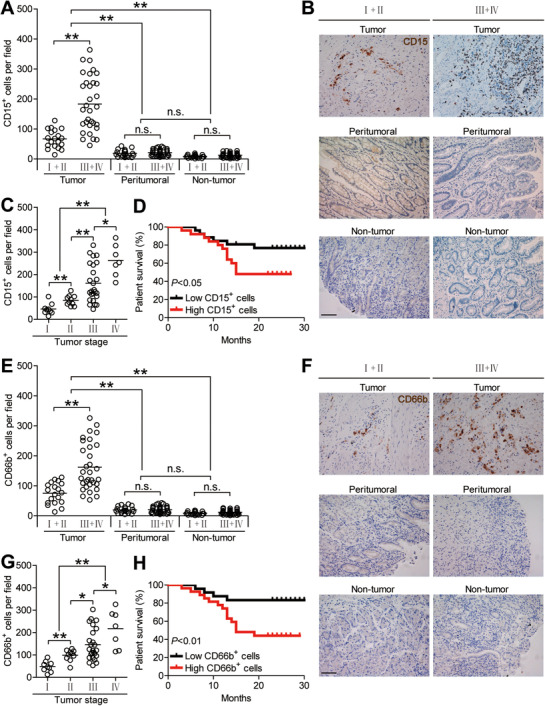
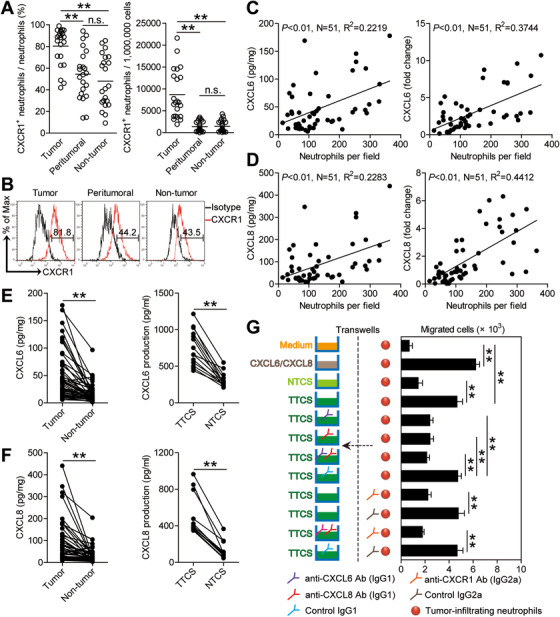
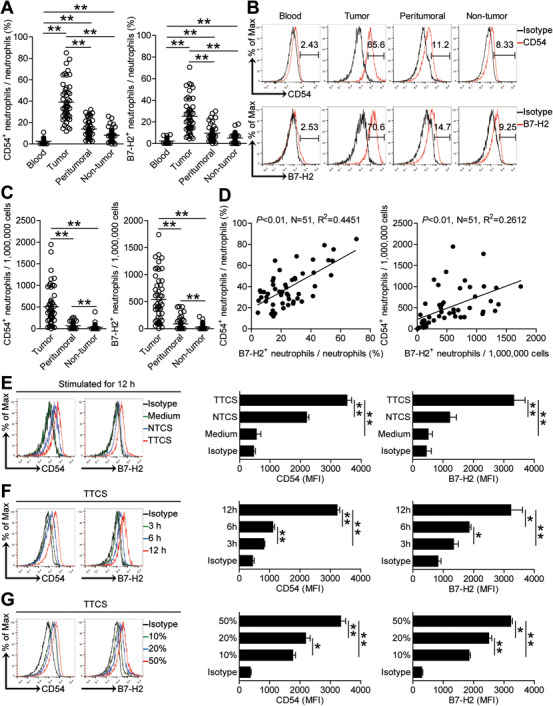
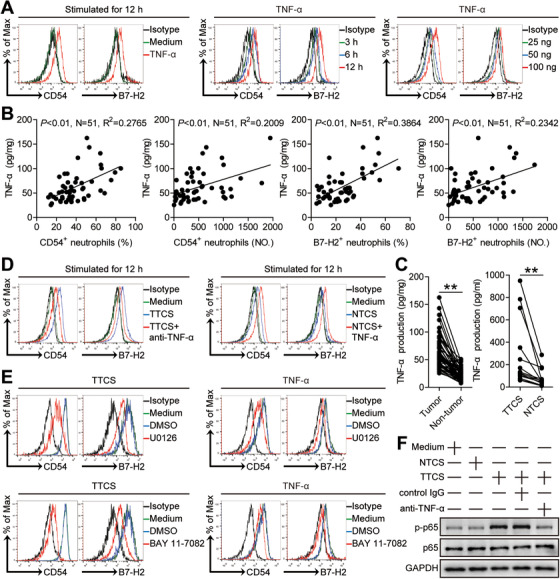
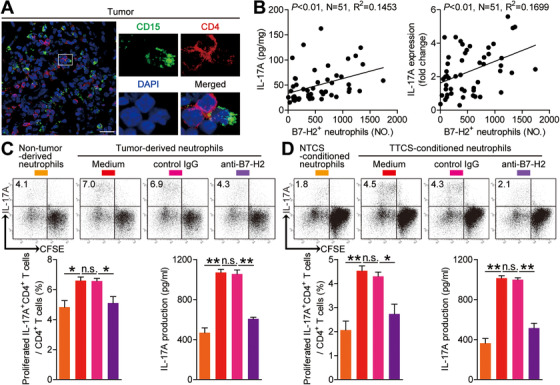
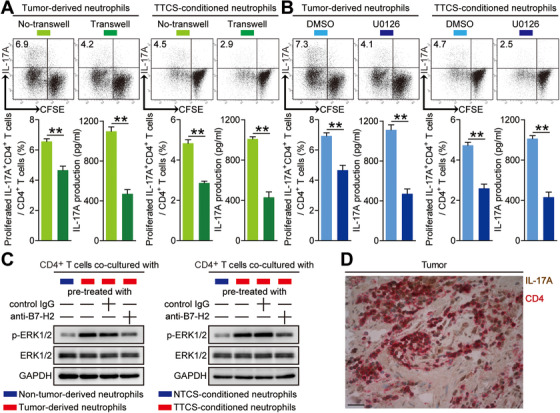
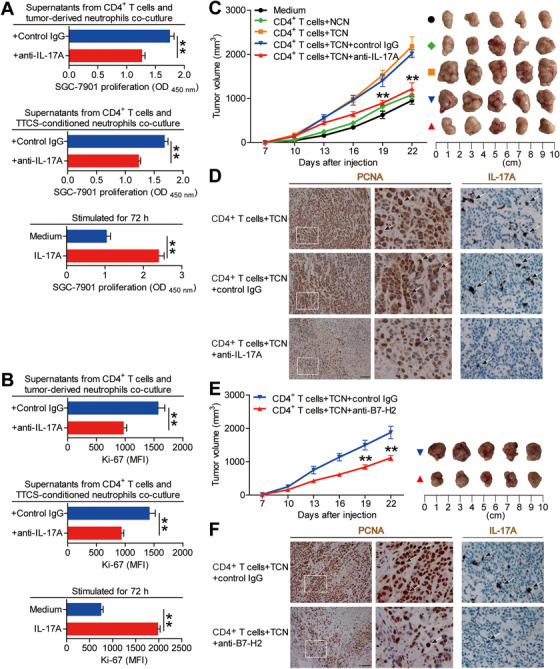
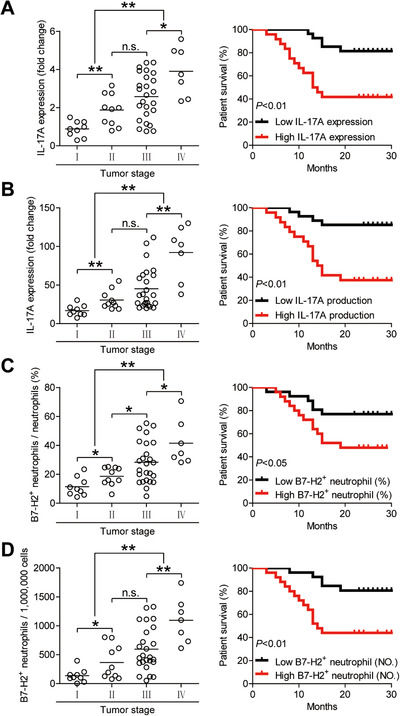
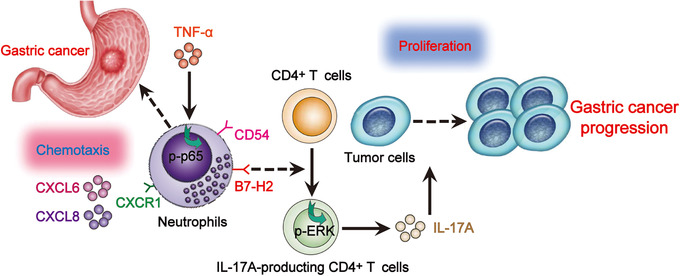
Results: GC patients exhibited increased tumoral neutrophil infiltration with GC progression and poor patient prognosis. Intratumoral neutrophils accumulated in GC tumors via CXCL6/CXCL8-CXCR1-mediated chemotaxis, and expressed activated molecule CD54 and co-signaling molecule B7-H2. Neutrophils induced by tumors strongly expressed CD54 and B7-H2 in both dose- and time-dependent manners, and a close correlation was obtained between the expressions of CD54 and B7-H2 on intratumoral neutrophils. Tumor-derived tumor necrosis factor-α (TNF-α) promoted neutrophil activation and neutrophil B7-H2 expression through ERK-NF-κB pathway, and a significant correlation was found between the levels of TNF-α and CD54+ or B7-H2+ neutrophils in tumor tissues. Tumor-infiltrating and tumor-conditioned neutrophils effectively induced IL-17A-producing Th subset polarization through a B7-H2-dependent manner ex vivo and these polarized IL-17A-producing Th cells exerted protumorigenic roles by promoting GC tumor cell proliferation via inflammatory molecule IL-17A in vitro, which promoted the progression of human GC in vivo; these effects could be reversed when IL-17A is blocked. Moreover, increased B7-H2+ neutrophils and IL-17A in tumors were closely related to advanced GC progression and predicted poor patient survival.

Conclusion: We illuminate novel underlying mechanisms that TNF-α-activated neutrophils link B7-H2 to protumorigenic IL-17A-producing Th subset polarization in human GC. Blocking this pathological TNF-α-B7-H2-IL-17A pathway may be useful therapeutic strategies for treating GC.

Keywords: B7-H2; IL-17A; gastric cancer; neutrophils.


Conflict of interest statement

The authors declare that there are no conflict of interest.

Figures

FIGURE 1
FIGURE 1
Neutrophils are increased in GC tumors as tumor progress and predict poor patient survival. (A) CD15+ neutrophil number among TNM stages (I+II vs III+IV) in each tissue of patients with GC by immunohistochemical staining and counting. Cumulative results from 51 GC patients were shown. (B) Representative analysis of CD15+ (brown) neutrophil distributions in tumor, peritumoral and non‐tumor tissues of GC patients by immunohistochemical staining. Scale bars: 100 microns. (C) Intratumoral CD15+ neutrophil number among TNM stages was compared. (D) Kaplan‐Meier plots for overall survival by median CD15+ neutrophil number (112 per field). (E) CD66b+ neutrophil number among TNM stages (I+II vs III+IV) in each tissue of patients with GC by immunohistochemical staining and counting. Cumulative results from 51 GC patients were shown. (F) Representative analysis of CD66b+ (brown) neutrophil distributions in tumor, peritumoral, and non‐tumor tissues of GC patients by immunohistochemical staining. Scale bars: 100 microns. (G) Intratumoral CD66b+ neutrophil number among TNM stages was compared. (H) Kaplan‐Meier plots for overall survival by median CD66b+ neutrophil number (111 per field). The horizontal bars in panels (A, C, E, or G) represent mean values. Each ring in panels (A, C, E, or G) represents one patient. *< 0.05; **< 0.01, n.s. > 0.05 for groups connected by horizontal lines
FIGURE 2
FIGURE 2
Increased neutrophil accumulation in GC tumors is promoted by CXCL6/CXCL8‐CXCR1‐mediated chemotaxis. (A) Statistics analysis of CXCR1+ neutrophil percentage in total neutrophils and the number of CXCR1+ neutrophils per million total cells in each samples of patients with GC by gating on CD45+CD11b+CD66b+CD15+CXCR1+ cells and counting (n = 22). (B) Expression of molecule CXCR1 on neutrophils. Color histograms represent staining of CXCR1; black, isotype control. (C) The correlations between neutrophils and CXCL6 in GC tumors were analyzed (n = 51). Results were expressed as neutrophil number and CXCL6 concentration/expression in tumor tissues. (D) The correlations between neutrophils and CXCL8 in GC tumors were analyzed (n = 51). Results were expressed as neutrophil number and CXCL8 concentration/expression in tumor tissues. (E) CXCL6 concentration between autologous tumor and non‐tumor tissues (n = 51) or between autologous TTCS and NTCS (n = 14) was analyzed. (F) CXCL8 concentration between autologous tumor and non‐tumor tissues (n = 51) or between autologous TTCS and NTCS (n = 14) was analyzed. (G) Migration of tumor‐infiltrating neutrophils was assessed by Transwell assay as described in Methods and statistically analyzed (n = 5). The horizontal bars in panels A represent mean values. Each ring or dot in panels (A, C, D, E, or F) represents one patient. Ab: antibody. *< 0.05; **< 0.01; n.s. > 0.05 for groups connected by horizontal lines
FIGURE 3
FIGURE 3
Human GC environments induce neutrophil activation and B7‐H2 expression. (A and C) Statistics analysis of CD54+ neutrophil percentage and B7‐H2+ neutrophil percentage in total neutrophils (A) and the number of CD54+ neutrophils and B7‐H2+ neutrophils per million total cells (C) in each samples of patients with GC by gating on CD45+CD11b+CD66b+CD15+CD54+ cells and CD45+CD11b+CD66b+CD15+B7‐H2+ cells and counting (n = 51). (B) Expression of molecule CD54 and B7‐H2 on neutrophils. Color histograms represent staining of CD54 and B7‐H2; black, isotype control. (D) The correlations between CD54+ neutrophils and B7‐H2+ neutrophils in human tumors were analyzed. Results are expressed as the percentage of CD54+ neutrophils and B7‐H2+ neutrophils in total neutrophils or the number of CD54+ neutrophils and B7‐H2+ neutrophils per million total cells in tumor tissues. (E) Representative data and statistical analysis of the expression of CD54 and B7‐H2 on neutrophils of healthy donors exposed to 50% autologous TTCS and NTCS for 12 hours (n = 3). black, isotype control. (F) Representative data and statistical analysis of the expression of CD54 and B7‐H2 on neutrophils exposed to 50% TTCS for 3, 6, 12 h (n = 3). black, isotype control. (G) Representative data and statistical analysis of the expression of CD54 and B7‐H2 on neutrophils exposed to 10%, 20%, 50% TTCS for 12 h (n = 3). black, isotype control. The horizontal bars in panels A or C represent mean values. Each ring or dot in panels (A, C, or D) represents one patient. MFI: mean fluorescence intensity. *< 0.05; **< 0.01 for groups connected by horizontal lines
FIGURE 4
FIGURE 4
Tumor‐derived TNF‐α activates neutrophils and induces B7‐H2 expression on neutrophils via ERK‐NF‐κB pathway. (A) Expression of CD54 and B7‐H2 on neutrophils exposed to TNF‐α (100 ng/ml) or medium control for 12 h, or exposed to TNF‐α (100 ng/ml) for 3, 6, 12 h, or exposed to TNF‐α (25, 50, or 100 ng/ml) for 12 h. black, isotype control. (B) The correlations between TNF‐α and CD54+ neutrophils or B7‐H2+ neutrophils in human tumors were analyzed. Results are expressed as the percentage of CD54+ neutrophils and B7‐H2+ neutrophils in total neutrophils or the number of CD54+ neutrophils and B7‐H2+ neutrophils per million total cells and TNF‐α concentration in tumor tissues. (C) TNF‐α concentration between autologous tumor and non‐tumor tissues (n = 51) or between autologous TTCS and NTCS (n = 14) was analyzed. (D) Expression of CD54 and B7‐H2 on neutrophils exposed to TTCS with anti‐TNF‐α antibody or NTCS with TNF‐α for 12 h. (E) Expression of CD54 and B7‐H2 on neutrophils exposed to TTCS or TNF‐α with or without U0126 (an ERK inhibitor) or BAY 11‐7082 (an IκBα inhibitor) for 12 h. black, isotype control. (F) The p65 and p‐p65 proteins in neutrophils exposed to autologous TTCS, NTCS, or TTCS with anti‐TNF‐α antibody or control IgG for 12 h were analyzed by western blot. Each dot in panel (B) or (C) represents one patient. **< 0.01 for groups connected by horizontal lines
FIGURE 5
FIGURE 5
Tumor‐infiltrating and tumor‐conditioned neutrophils induce protumorigenic IL‐17A‐producing Th subset polarization through a B7‐H2‐dependent manner. (A) Representative analysis of CD15+ neutrophil (green) and CD4+ T cell (red) interactions in tumor tissues of GC patients by immunofluorescence. Scale bars: 20 microns. (B) The correlations between B7‐H2+ neutrophils and IL‐17A in human GC tumors were analyzed. Results are expressed as the number of B7‐H2+ neutrophils per million total cells and IL‐17A concentration or IL‐17A expression in tumor tissues. (C) CFSE‐labeled peripheral CD4+ T cells of GC patients were co‐cultured for 4 days with autologous neutrophils from non‐tumor or tumor tissues with or without anti‐B7‐H2 antibody. Representative data and statistical analysis of proliferated IL‐17A‐producing CD4+ T cells and IL‐17A production were shown (n = 3). (D) CFSE‐labeled peripheral CD4+ T cells of donors were co‐cultured for 4 days with autologous NTCS‐conditioned neutrophils or TTCS‐conditioned neutrophils with or without anti‐B7‐H2 antibody. Representative data and statistical analysis of proliferated IL‐17A‐producing CD4+ T cells and IL‐17A production were shown (n = 3). Each dot in panel (B) represents one patient. *< 0.05; **< 0.01; n.s. > 0.05 for groups connected by horizontal lines
FIGURE 6
FIGURE 6
Tumor‐infiltrating and tumor‐conditioned neutrophils induce protumorigenic IL‐17A‐producing Th subset polarization through a B7‐H2‐ERK pathway. (A) CFSE‐labeled peripheral CD4+ T cells of GC patients or donors were co‐cultured for 4 days with autologous neutrophils from tumor tissues or autologous TTCS‐conditioned neutrophils with or without transwells. Representative data and statistical analysis of proliferated IL‐17A‐producing CD4+ T cells and IL‐17A production were shown (n = 3). (B) CFSE‐labeled peripheral CD4+ T cells of GC patients or donors pretreated with DMSO or U0126 were co‐cultured for 4 days with autologous neutrophils from tumor tissues or autologous TTCS‐conditioned neutrophils. Representative data and statistical analysis of proliferated IL‐17A‐producing CD4+ T cells and IL‐17A production were shown (n = 3). (C) Autologous neutrophils isolated from tumor or non‐tumor tissues, and TTCS‐ or NTCS‐conditioned neutrophils were pretreated with or without human B7‐H2 neutralizing antibody or control IgG (20 µg/ml) for 2 h. Then peripheral CD4+ T cells were co‐cultured with these neutrophils for 4 days. The ERK1/2 and p‐ERK1/2 proteins in CD4+ T cells were analyzed by western blot. (D) Representative analysis of IL‐17A‐expressing (brown) CD4+ cells (red) in tumor tissues of GC patients by immunohistochemical staining. Scale bars: 20 microns. *< 0.05; **< 0.01; n.s. > 0.05 for groups connected by horizontal lines
FIGURE 7
FIGURE 7
Blockade of IL‐17A from tumor‐associated neutrophil‐polarized IL‐17A‐producing Th subsets inhibits tumor growth and GC progression in vivo. (A and B) GC cells were stimulated with the culture supernatants from autologous peripheral CD4+ T cells and tumor‐derived neutrophils plus control IgG or IL‐17A neutralizing antibody, or the culture supernatants from autologous peripheral CD4+ T cells and TTCS‐conditioned neutrophils plus control IgG or IL‐17A neutralizing antibody, or exposed to IL‐17A as described in Methods. The proliferation of GC cells was analyzed by using CCK‐8 Kits (A) and Ki‐67 staining (B) (n = 3). **< 0.01 for groups connected by horizontal lines. (C) Mice were injected with human SGC‐7901 cells, as described in Section 2. The control animals received no further injections. The experimental treatments entailed injections with CD4+ T cells in combination with NTCS‐conditioned neutrophils (NCN) or with CD4+ T cells in combination with TTCS‐conditioned neutrophils (TCN), followed sequentially injecting with IL‐17A blocking antibody or control IgG. The illustrated data represent tumor volumes (5 mice in each group). The day of tumor cell injection was counted as day 0. **< 0.01, for groups injected with CD4+ T cells in combination with TCN and anti‐IL‐17A antibody, compared with groups injected with CD4+ T cells in combination with TCN and control IgG. The tumors were excised and photographed 22 days after injecting the tumor cells. (D) The proliferating cell nuclear antigen (PCNA) and IL‐17A expressions (brown) in tumors were analyzed. Scale bars: 100 microns. The arrowheads indicated PCNA positive or IL‐17A positive cells. (E) Mice were injected with human SGC‐7901 cells, as described in Methods. The experimental treatments entailed injections with CD4+ T cells in combination with TTCS‐conditioned neutrophils (TCN) plus B7‐H2 blocking antibody or control IgG. The illustrated data represent tumor volumes (5 mice in each group). The day of tumor cell injection was counted as day 0. **< 0.01, for groups injected with CD4+ T cells in combination with TCN plus B7‐H2 blocking antibody, compared with groups injected with CD4+ T cells in combination with TCN plus control IgG. The tumors were excised and photographed 22 days after injecting the tumor cells. (F) The proliferating cell nuclear antigen (PCNA) and IL‐17A expressions (brown) in tumors were analyzed. Scale bars: 100 microns. The arrowheads indicated PCNA positive or IL‐17A positive cells
FIGURE 8
FIGURE 8
B7‐H2+ neutrophils correlate with advanced tumor stage and poor survival in patients with GC. (A) Intratumoral IL‐17A expression among TNM stages was compared. Kaplan‐Meier plots for overall survival by median IL‐17A expression (2.1‐fold change). (B) Intratumoral IL‐17A production among TNM stages was compared. Kaplan‐Meier plots for overall survival by median IL‐17A production (30.01721 pg/mg). (C) Intratumoral B7‐H2+ neutrophil percentage in total neutrophils (%) among TNM stages was compared. Kaplan‐Meier plots for overall survival by median B7‐H2+ neutrophil percentage (22.8). Results are analyzed as the percentage of B7‐H2+ neutrophils in total neutrophils in tumor tissues. (D) Intratumoral B7‐H2+ neutrophil number per million total cells (NO.) among TNM stages was compared. Kaplan‐Meier plots for overall survival by median B7‐H2+ neutrophil number (416). Results are analyzed as the number of B7‐H2+ neutrophils per million total cells in tumor tissues. The horizontal bars in panels (A–D) represent mean values. Each ring in panels (A–D) represents one patient. *< 0.05; **< 0.01; n.s. > 0.05 for groups connected by horizontal lines
FIGURE 9
FIGURE 9
A proposed model of cross‐talks among neutrophils, CD4+ T cells, and tumor cells leading to neutrophil‐mediated protumorigenic IL‐17A‐producing Th subset polarization and tumor progression in GC environment. CXCL6/CXCL8‐CXCR1 chemotaxis mediates the recruitment and accumulation of neutrophils into GC environment, which upregulate CD54 and B7‐H2 expression via ERK‐NF‐κB signaling pathway activation by tumor‐derived TNF‐α. Neutrophils polarize IL‐17A‐producing Th subsets in a B7‐H2‐dependent manner; these polarized IL‐17A‐producing Th cells exert protumorigenic roles via inflammatory molecule IL‐17A, which contributed to the growth and progression of human GC

Similar articles

Cited by

References

    1. Van Cutsem E, Sagaert X, Topal B, Haustermans K, Prenen H. Gastric Cancer Lancet. 2016;388:2654‐2664. - PubMed
    1. Ferrone C, Dranoff G. Dual roles for immunity in gastrointestinal cancers. J Clin Oncol. 2010;28:4045‐4051. - PMC - PubMed
    1. Zou W. Immunosuppressive networks in the tumour environment and their therapeutic relevance. Nat Rev Cancer. 2005;5:263‐274. - PubMed
    1. Kuang DM, Peng C, Zhao Q, Wu Y, Chen MS, Zheng L. Activated monocytes in peritumoral stroma of hepatocellular carcinoma promote expansion of memory T helper 17 cells. Hepatology. 2010;51:154‐164. - PubMed
    1. Zhuang Y, Peng LS, Zhao YL, et al. CD8(+) T cells that produce interleukin‐17 regulate myeloid‐derived suppressor cells and are associated with survival time of patients with gastric cancer. Gastroenterology. 2012;143:951‐962 e8. - PubMed

Publication types

MeSH terms