Dual role of the miR-146 family in rhinovirus-induced airway inflammation and allergic asthma exacerbation
- PMID: 34185416
- PMCID: PMC8161513
- DOI: 10.1002/ctm2.427
Dual role of the miR-146 family in rhinovirus-induced airway inflammation and allergic asthma exacerbation
Abstract
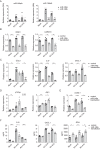
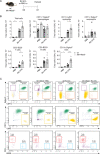
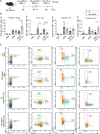
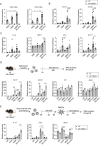
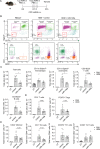
Rhinovirus (RV) infections are associated with asthma exacerbations. MicroRNA-146a and microRNA-146b (miR-146a/b) are anti-inflammatory miRNAs that suppress signaling through the nuclear factor kappa B (NF-κB) pathway and inhibit pro-inflammatory chemokine production in primary human bronchial epithelial cells (HBECs). In the current study, we aimed to explore whether miR-146a/b could regulate cellular responses to RVs in HBECs and airways during RV-induced asthma exacerbation. We demonstrated that expression of miR-146a/b and pro-inflammatory chemokines was increased in HBECs and mouse airways during RV infection. However, transfection with cell-penetrating peptide (CPP)-miR-146a nanocomplexes before infection with RV significantly reduced the expression of the pro-inflammatory chemokines CCL5, IL-8 and CXCL1, increased interferon-λ production, and attenuated infection with the green fluorescent protein (GFP)-expressing RV-A16 in HBECs. Concordantly, compared to wild-type (wt) mice, Mir146a/b-/- mice exhibited more severe airway neutrophilia and increased T helper (Th)1 and Th17 cell infiltration in response to RV-A1b infection and a stronger Th17 response with a less prominent Th2 response in house dust mite extract (HDM)-induced allergic airway inflammation and RV-induced exacerbation models. Interestingly, intranasal administration of CPP-miR-146a nanocomplexes reduced HDM-induced allergic airway inflammation without a significant effect on the Th2/Th1/Th17 balance in wild-type mice. In conclusion, the overexpression of miR-146a has a strong anti-inflammatory effect on RV infection in HBECs and a mouse model of allergic airway inflammation, while a lack of miR-146a/b leads to attenuated type 2 cell responses in mouse models of allergic airway inflammation and RV-induced exacerbation of allergic airway inflammation. Furthermore, our data indicate that the application of CPP-miR-146a nanocomplexes has therapeutic potential for targeting airway inflammation.
Keywords: asthma; bronchial epithelial cell; house dust mite; microRNA; neutrophils; noncoding RNA; viral infection.
© 2021 The Authors. Clinical and Translational Medicine published by John Wiley & Sons Australia, Ltd on behalf of Shanghai Institute of Clinical Bioinformatics.
Conflict of interest statement
Ana Rebane and Margus Pooga are board members of RNAexact OÜ. All other authors declare no conflict of interest regarding this manuscript.
Figures




Similar articles
-
TRAIL signaling is proinflammatory and proviral in a murine model of rhinovirus 1B infection.Am J Physiol Lung Cell Mol Physiol. 2017 Jan 1;312(1):L89-L99. doi: 10.1152/ajplung.00200.2016. Epub 2016 Nov 11. Am J Physiol Lung Cell Mol Physiol. 2017. PMID: 27836899
-
No exacerbation but impaired anti-viral mechanisms in a rhinovirus-chronic allergic asthma mouse model.Clin Sci (Lond). 2014 Jan 1;126(1):55-65. doi: 10.1042/CS20130174. Clin Sci (Lond). 2014. PMID: 23822145
-
miR-146a-5p Attenuates Allergic Airway Inflammation by Inhibiting the NLRP3 Inflammasome Activation in Macrophages.Int Arch Allergy Immunol. 2022;183(9):919-930. doi: 10.1159/000524718. Epub 2022 Jun 3. Int Arch Allergy Immunol. 2022. PMID: 35660690
-
Involvement and Possible Role of Eosinophils in Asthma Exacerbation.Front Immunol. 2018 Sep 28;9:2220. doi: 10.3389/fimmu.2018.02220. eCollection 2018. Front Immunol. 2018. PMID: 30323811 Free PMC article. Review.
-
Rhinovirus and Asthma Exacerbations.Immunol Allergy Clin North Am. 2019 Aug;39(3):335-344. doi: 10.1016/j.iac.2019.03.003. Epub 2019 May 15. Immunol Allergy Clin North Am. 2019. PMID: 31284924 Free PMC article. Review.
Cited by
-
MiR-146a-5p engineered hucMSC-derived extracellular vesicles attenuate Dermatophagoides farinae-induced allergic airway epithelial cell inflammation.Front Immunol. 2024 Sep 19;15:1443166. doi: 10.3389/fimmu.2024.1443166. eCollection 2024. Front Immunol. 2024. PMID: 39364406 Free PMC article.
-
The Roles of MicroRNAs in Asthma and Emerging Insights into the Effects of Vitamin D3 Supplementation.Nutrients. 2024 Jan 24;16(3):341. doi: 10.3390/nu16030341. Nutrients. 2024. PMID: 38337625 Free PMC article. Review.
-
Neferine Attenuates HDM-Induced Allergic Inflammation by Inhibiting the Activation of Dendritic Cell.Inflammation. 2023 Dec;46(6):2433-2448. doi: 10.1007/s10753-023-01891-6. Epub 2023 Sep 13. Inflammation. 2023. PMID: 37702907
-
Recent miRNA Research in Asthma.Curr Allergy Asthma Rep. 2022 Dec;22(12):231-258. doi: 10.1007/s11882-022-01050-1. Epub 2022 Dec 2. Curr Allergy Asthma Rep. 2022. PMID: 36459329 Free PMC article. Review.
-
MiR-203 is an anti-obese microRNA by targeting apical sodium-dependent bile acid transporter.iScience. 2022 Jul 2;25(8):104708. doi: 10.1016/j.isci.2022.104708. eCollection 2022 Aug 19. iScience. 2022. PMID: 35856025 Free PMC article.
References
-
- Boonpiyathad T, Sözener ZC, Satitsuksanoa P, Akdis CA. Immunologic mechanisms in asthma. Semin Immunol. 2019;46:101333. - PubMed
-
- Traister RS, Wenzel SE. Inflammatory phenotypes in asthma pathogenesis. Drug Discovery Today: Disease Mechanisms. 2012;9(3‐4):e75–e81. - PubMed
-
- Malmhäll C, Alawieh S, Lu Y, Sjöstrand M, Bossios A, Eldh M, Rådinger M. MicroRNA‐155 is essential for TH2‐mediated allergen‐induced eosinophilic inflammation in the lung. Journal of Allergy and Clinical Immunology. 2014;133 (5):1429–1438.e7. - PubMed
Publication types
MeSH terms
Substances
Grants and funding
LinkOut - more resources
Full Text Sources
Medical
