An integrated magneto-electrochemical device for the rapid profiling of tumour extracellular vesicles from blood plasma
- PMID: 34183802
- PMCID: PMC8437135
- DOI: 10.1038/s41551-021-00752-7
An integrated magneto-electrochemical device for the rapid profiling of tumour extracellular vesicles from blood plasma
Abstract
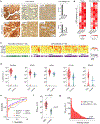
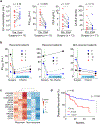
Assays for cancer diagnosis via the analysis of biomarkers on circulating extracellular vesicles (EVs) typically have lengthy sample workups, limited throughput or insufficient sensitivity, or do not use clinically validated biomarkers. Here we report the development and performance of a 96-well assay that integrates the enrichment of EVs by antibody-coated magnetic beads and the electrochemical detection, in less than one hour of total assay time, of EV-bound proteins after enzymatic amplification. By using the assay with a combination of antibodies for clinically relevant tumour biomarkers (EGFR, EpCAM, CD24 and GPA33) of colorectal cancer (CRC), we classified plasma samples from 102 patients with CRC and 40 non-CRC controls with accuracies of more than 96%, prospectively assessed a cohort of 90 patients, for whom the burden of tumour EVs was predictive of five-year disease-free survival, and longitudinally analysed plasma from 11 patients, for whom the EV burden declined after surgery and increased on relapse. Rapid assays for the detection of combinations of tumour biomarkers in plasma EVs may aid cancer detection and patient monitoring.
© 2021. The Author(s), under exclusive licence to Springer Nature Limited.
Conflict of interest statement
Competing interests
R.W. declares that he has received consultancy payments from Accure Health, and that he is a shareholder of Lumicell. H.L. declares that he has received consultancy payments from Accure Health. Patents: all patents associated with R.W. and H.L. have been assigned to and handled by Massachusetts General Hospital.
Figures


Similar articles
-
Integrated Microfluidic Device for Accurate Extracellular Vesicle Quantification and Protein Markers Analysis Directly from Human Whole Blood.Anal Chem. 2020 Jan 7;92(1):1574-1581. doi: 10.1021/acs.analchem.9b04852. Epub 2019 Dec 10. Anal Chem. 2020. PMID: 31779307
-
Extracellular Vesicle-Transported Long Non-Coding RNA (LncRNA) X Inactive-Specific Transcript (XIST) in Serum is a Potential Novel Biomarker for Colorectal Cancer Diagnosis.Med Sci Monit. 2020 Aug 15;26:e924448. doi: 10.12659/MSM.924448. Med Sci Monit. 2020. PMID: 32843612 Free PMC article.
-
Identification and validation of the surface proteins FIBG, PDGF-β, and TGF-β on serum extracellular vesicles for non-invasive detection of colorectal cancer: experimental study.Int J Surg. 2024 Aug 1;110(8):4672-4687. doi: 10.1097/JS9.0000000000001533. Int J Surg. 2024. PMID: 38704642 Free PMC article.
-
Exosomal microRNAs and other non-coding RNAs as colorectal cancer biomarkers: a review.Mutagenesis. 2020 Jul 11;35(3):243-260. doi: 10.1093/mutage/gez038. Mutagenesis. 2020. PMID: 31784760 Review.
-
The emerging clinical potential of circulating extracellular vesicles for non-invasive glioma diagnosis and disease monitoring.Brain Tumor Pathol. 2019 Apr;36(2):29-39. doi: 10.1007/s10014-019-00335-0. Epub 2019 Mar 11. Brain Tumor Pathol. 2019. PMID: 30859343 Review.
Cited by
-
Ratiometric electrochemical OR gate assay for NSCLC-derived exosomes.J Nanobiotechnology. 2023 Mar 24;21(1):104. doi: 10.1186/s12951-023-01833-2. J Nanobiotechnology. 2023. PMID: 36964516 Free PMC article.
-
Amplifying mutational profiling of extracellular vesicle mRNA with SCOPE.Nat Biotechnol. 2024 Oct 7. doi: 10.1038/s41587-024-02426-6. Online ahead of print. Nat Biotechnol. 2024. PMID: 39375445
-
Blood Circulating CD133+ Extracellular Vesicles Predict Clinical Outcomes in Patients with Metastatic Colorectal Cancer.Cancers (Basel). 2022 Mar 7;14(5):1357. doi: 10.3390/cancers14051357. Cancers (Basel). 2022. PMID: 35267665 Free PMC article.
-
Multielectrode Spectroscopy Enables Rapid and Sensitive Molecular Profiling of Extracellular Vesicles.ACS Cent Sci. 2022 Jan 26;8(1):110-117. doi: 10.1021/acscentsci.1c01193. Epub 2022 Jan 7. ACS Cent Sci. 2022. PMID: 35111901 Free PMC article.
-
Exosomes as a new frontier of cancer liquid biopsy.Mol Cancer. 2022 Feb 18;21(1):56. doi: 10.1186/s12943-022-01509-9. Mol Cancer. 2022. PMID: 35180868 Free PMC article. Review.
References
-
- Heitzer E, Haque IS, Roberts CES & Speicher MR Current and future perspectives of liquid biopsies in genomics-driven oncology. Nat. Rev. Genet 20, 77–88 (2018). - PubMed
-
- Siravegna G, Marsoni S, Siena S & Bardelli A Integrating liquid biopsies into the management of cancer. Nat. Rev. Clin. Oncol 14, 531–548 (2017). - PubMed
-
- Chi KR The tumour trail left in blood. Nature 532, 269–271 (2016). - PubMed
-
- Pantel K & Alix-Panabieres C Real-time liquid biopsy in cancer patients: fact or fiction? Cancer Res. 73, 6384–6388 (2013). - PubMed
-
- Théry C, Ostrowski M & Segura E Membrane vesicles as conveyors of immune responses. Nat. Rev. Immunol 9, 581–593 (2009). - PubMed
Publication types
MeSH terms
Substances
Grants and funding
LinkOut - more resources
Full Text Sources
Medical
Research Materials
Miscellaneous

