

Increased uterine androgen receptor protein abundance results in implantation and mitochondrial defects in pregnant rats with hyperandrogenism and insulin resistance
- PMID: 34180022
- PMCID: PMC8455403
- DOI: 10.1007/s00109-021-02104-z
Increased uterine androgen receptor protein abundance results in implantation and mitochondrial defects in pregnant rats with hyperandrogenism and insulin resistance
Abstract
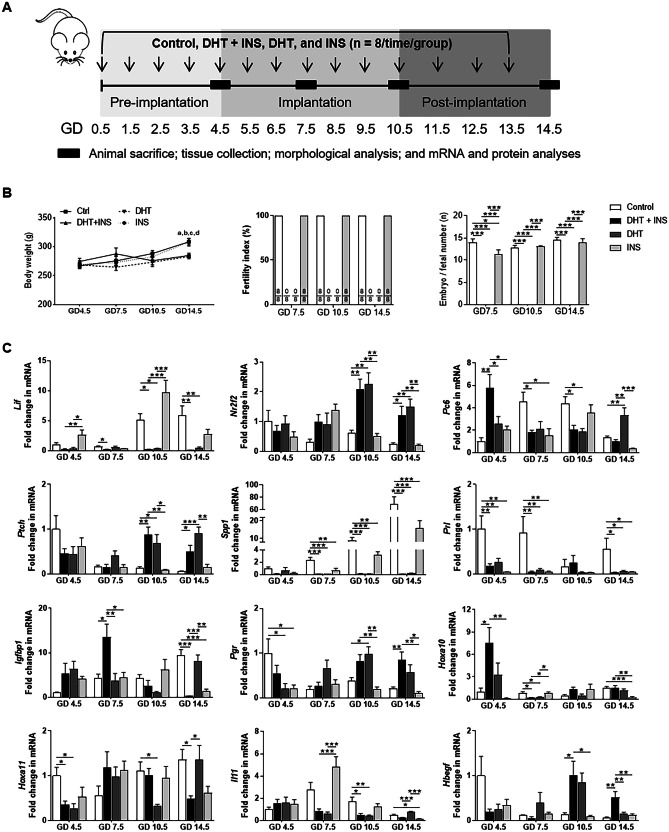
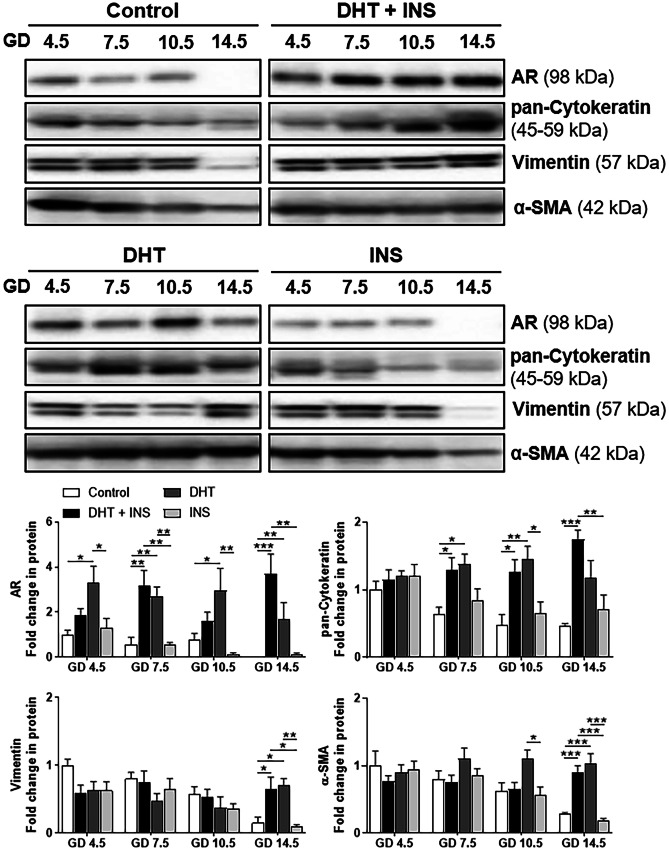
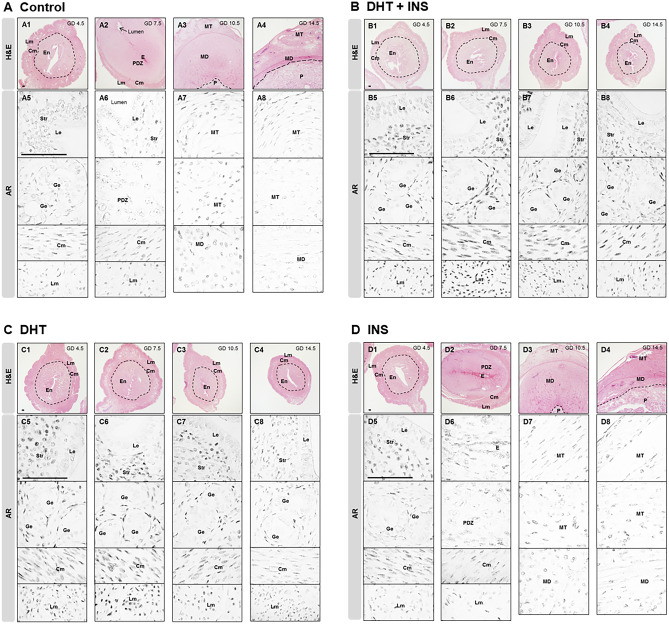
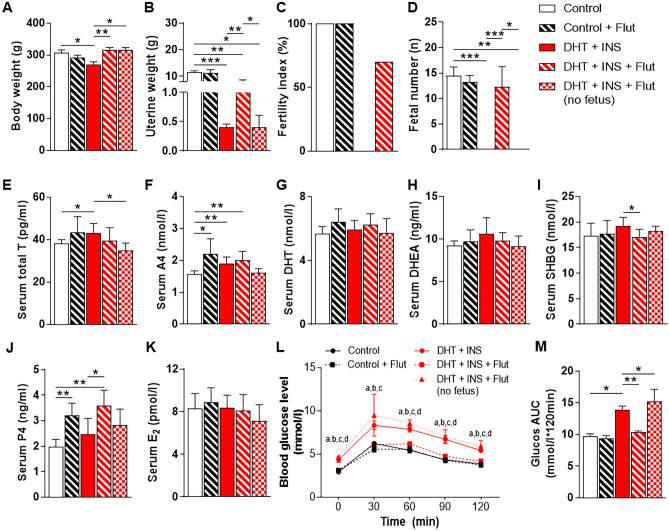
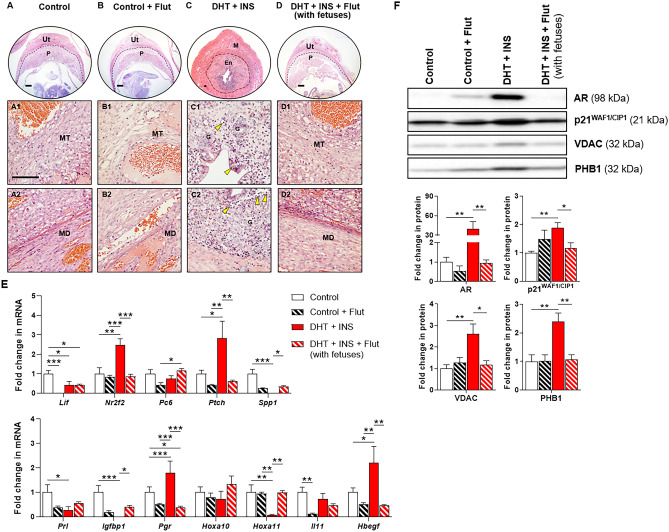
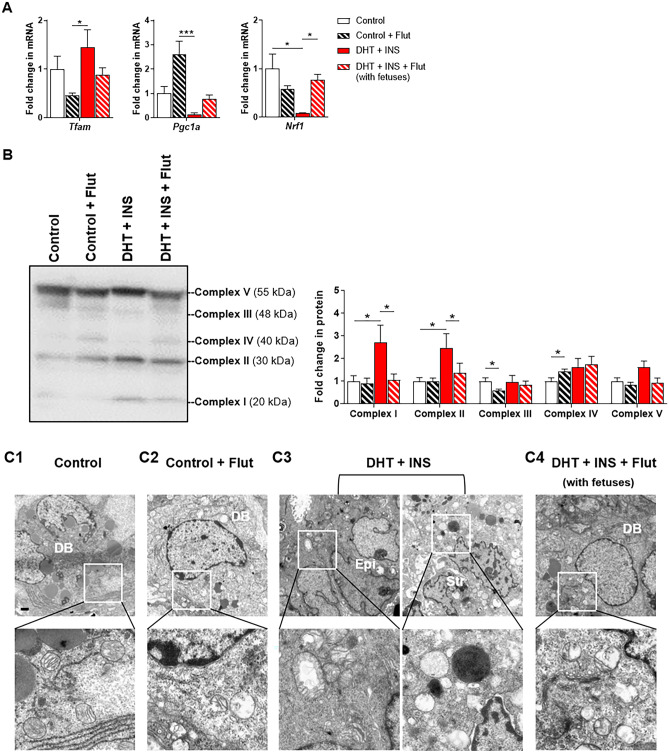
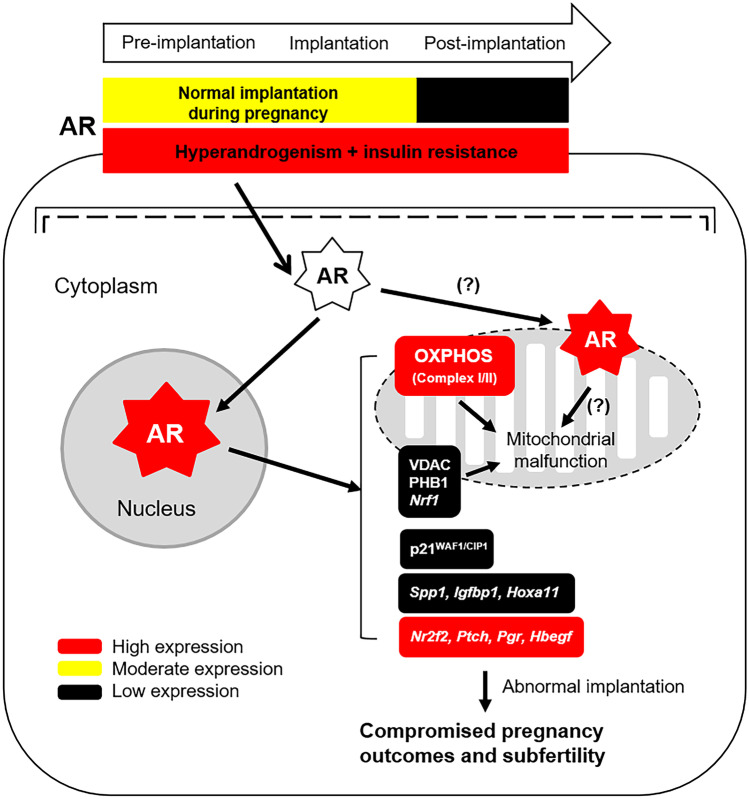
In this study, we show that during normal rat pregnancy, there is a gestational stage-dependent decrease in androgen receptor (AR) abundance in the gravid uterus and that this is correlated with the differential expression of endometrial receptivity and decidualization genes during early and mid-gestation. In contrast, exposure to 5α-dihydrotestosterone (DHT) and insulin (INS) or DHT alone significantly increased AR protein levels in the uterus in association with the aberrant expression of endometrial receptivity and decidualization genes, as well as disrupted implantation. Next, we assessed the functional relevance of the androgen-AR axis in the uterus for reproductive outcomes by treating normal pregnant rats and pregnant rats exposed to DHT and INS with the anti-androgen flutamide. We found that AR blockage using flutamide largely attenuated the DHT and INS-induced maternal endocrine, metabolic, and fertility impairments in pregnant rats in association with suppressed induction of uterine AR protein abundance and androgen-regulated response protein and normalized expression of several endometrial receptivity and decidualization genes. Further, blockade of AR normalized the expression of the mitochondrial biogenesis marker Nrf1 and the mitochondrial functional proteins Complexes I and II, VDAC, and PHB1. However, flutamide treatment did not rescue the compromised mitochondrial structure resulting from co-exposure to DHT and INS. These results demonstrate that functional AR protein is an important factor for gravid uterine function. Impairments in the uterine androgen-AR axis are accompanied by decreased endometrial receptivity, decidualization, and mitochondrial dysfunction, which might contribute to abnormal implantation in pregnant PCOS patients with compromised pregnancy outcomes and subfertility. KEY MESSAGES: The proper regulation of uterine androgen receptor (AR) contributes to a normal pregnancy process, whereas the aberrant regulation of uterine AR might be linked to polycystic ovary syndrome (PCOS)-induced pregnancy-related complications. In the current study, we found that during normal rat pregnancy there is a stage-dependent decrease in AR abundance in the gravid uterus and that this is correlated with the differential expression of the endometrial receptivity and decidualization genes Spp1, Prl, Igfbp1, and Hbegf. Pregnant rats exposed to 5α-dihydrotestosterone (DHT) and insulin (INS) or to DHT alone show elevated uterine AR protein abundance and implantation failure related to the aberrant expression of genes involved in endometrial receptivity and decidualization in early to mid-gestation. Treatment with the anti-androgen flutamide, starting from pre-implantation, effectively prevents DHT + INS-induced defects in endometrial receptivity and decidualization gene expression, restores uterine mitochondrial homeostasis, and increases the pregnancy rate and the numbers of viable fetuses. This study adds to our understanding of the mechanisms underlying poor pregnancy outcomes in PCOS patients and the possible therapeutic use of anti-androgens, including flutamide, after spontaneous conception.
Keywords: Androgen receptor; Flutamide; Implantation; Mitochondrial function; Polycystic ovary syndrome; Pregnant uterus.
© 2021. The Author(s).
Conflict of interest statement
The authors declare no competing interests.
Figures
Similar articles
-
Hyperandrogenism and Its Possible Effects on Endometrial Receptivity: A Review.Int J Mol Sci. 2023 Jul 27;24(15):12026. doi: 10.3390/ijms241512026. Int J Mol Sci. 2023. PMID: 37569402 Free PMC article. Review.
-
Hyperandrogenism and insulin resistance induce gravid uterine defects in association with mitochondrial dysfunction and aberrant reactive oxygen species production.Am J Physiol Endocrinol Metab. 2019 May 1;316(5):E794-E809. doi: 10.1152/ajpendo.00359.2018. Epub 2019 Mar 12. Am J Physiol Endocrinol Metab. 2019. PMID: 30860876
-
Hyperandrogenism and insulin resistance modulate gravid uterine and placental ferroptosis in PCOS-like rats.J Endocrinol. 2020 Sep;246(3):247-263. doi: 10.1530/JOE-20-0155. J Endocrinol. 2020. PMID: 32590339
-
Hyperandrogenism and insulin resistance-induced fetal loss: evidence for placental mitochondrial abnormalities and elevated reactive oxygen species production in pregnant rats that mimic the clinical features of polycystic ovary syndrome.J Physiol. 2019 Aug;597(15):3927-3950. doi: 10.1113/JP277879. Epub 2019 Jul 3. J Physiol. 2019. PMID: 31206177
-
Endometrium in PCOS: Implantation and predisposition to endocrine CA.Best Pract Res Clin Endocrinol Metab. 2006 Jun;20(2):235-44. doi: 10.1016/j.beem.2006.03.005. Best Pract Res Clin Endocrinol Metab. 2006. PMID: 16772154 Review.
Cited by
-
Sepia pharaonis Ink Mitigates Dehydroepiandrosterone-Induced Insulin Resistance in Mouse Model of Polycystic Ovarian Syndrome.Pathophysiology. 2024 Aug 15;31(3):408-419. doi: 10.3390/pathophysiology31030031. Pathophysiology. 2024. PMID: 39189167 Free PMC article.
-
Androgen signalling in the ovaries and endometrium.Mol Hum Reprod. 2023 May 31;29(6):gaad017. doi: 10.1093/molehr/gaad017. Mol Hum Reprod. 2023. PMID: 37171897 Free PMC article. Review.
-
Hyperandrogenism and Its Possible Effects on Endometrial Receptivity: A Review.Int J Mol Sci. 2023 Jul 27;24(15):12026. doi: 10.3390/ijms241512026. Int J Mol Sci. 2023. PMID: 37569402 Free PMC article. Review.
-
Implantation and Decidualization in PCOS: Unraveling the Complexities of Pregnancy.Int J Mol Sci. 2024 Jan 18;25(2):1203. doi: 10.3390/ijms25021203. Int J Mol Sci. 2024. PMID: 38256276 Free PMC article. Review.
-
Hyperinsulinemia impairs decidualization via AKT-NR4A1 signaling: new insight into polycystic ovary syndrome (PCOS)-related infertility.J Ovarian Res. 2024 Feb 3;17(1):31. doi: 10.1186/s13048-023-01334-8. J Ovarian Res. 2024. PMID: 38310251 Free PMC article.
References
-
- Hoeger KM, Dokras A, Piltonen T (2020) Update on PCOS: consequences, challenges and guiding treatment. J Clin Endocrinol Metab. 10.1210/clinem/dgaa839 - PubMed
Publication types
MeSH terms
Substances
LinkOut - more resources
Full Text Sources
Medical
Research Materials
Miscellaneous
