. 2021 Jun 22;12(1):3845.
doi: 10.1038/s41467-021-24131-7.

The Atr-Chek1 pathway inhibits axon regeneration in response to Piezo-dependent mechanosensation

Affiliations

The Atr-Chek1 pathway inhibits axon regeneration in response to Piezo-dependent mechanosensation

Feng Li et al. Nat Commun. .

Abstract

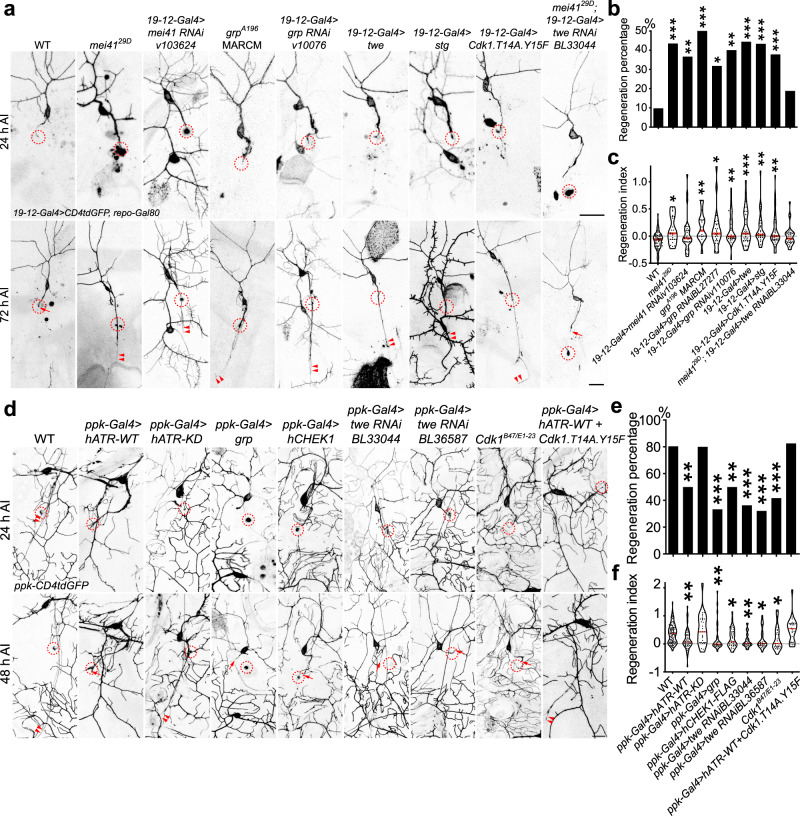
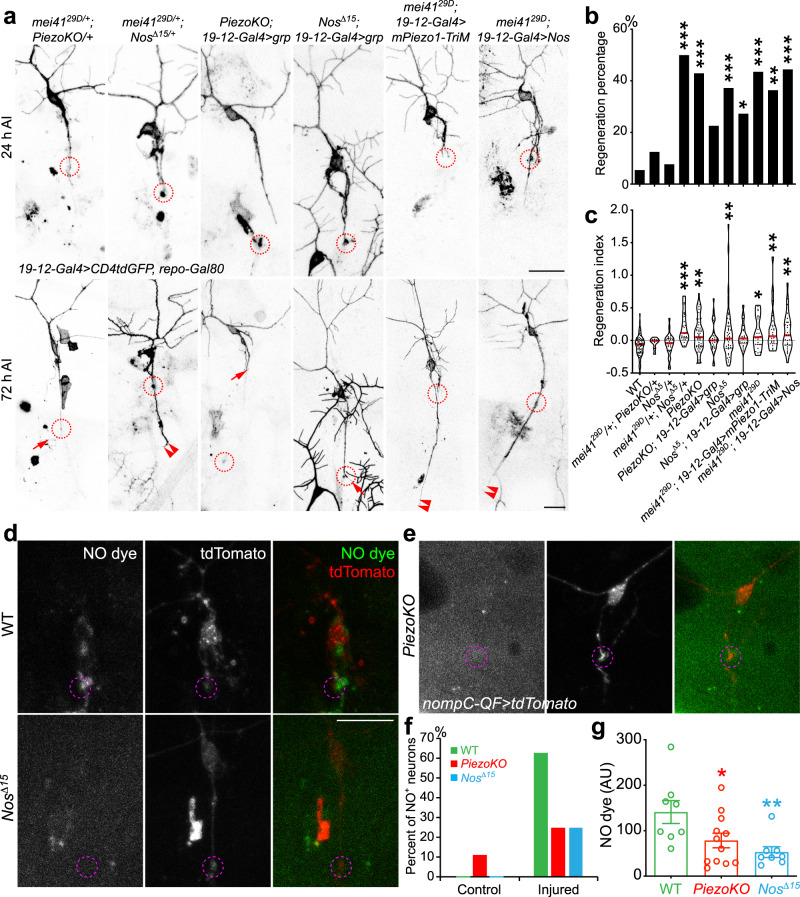
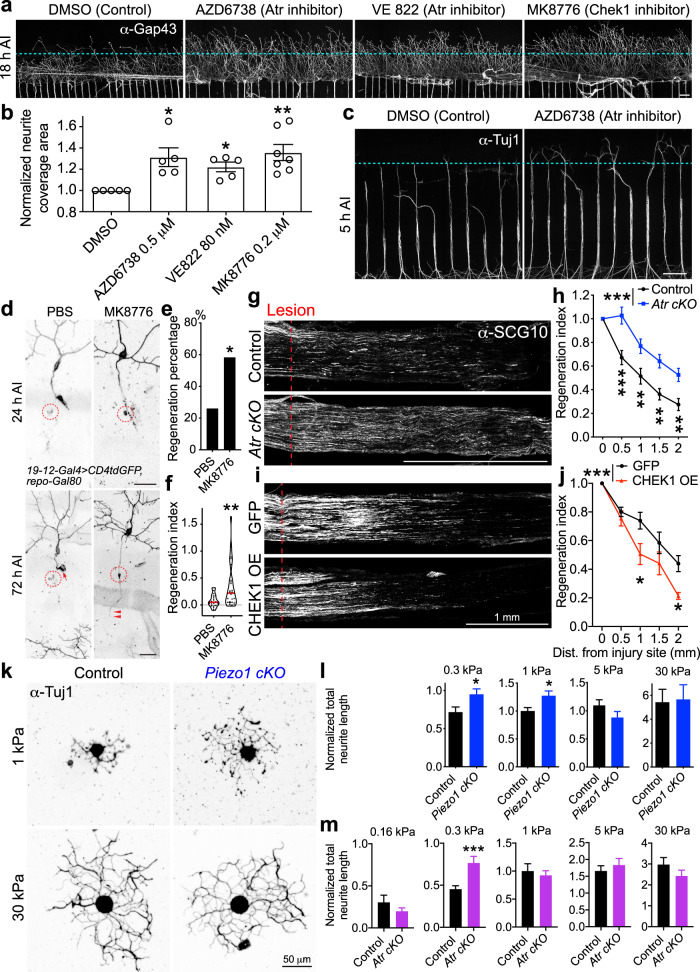
Atr is a serine/threonine kinase, known to sense single-stranded DNA breaks and activate the DNA damage checkpoint by phosphorylating Chek1, which inhibits Cdc25, causing cell cycle arrest. This pathway has not been implicated in neuroregeneration. We show that in Drosophila sensory neurons removing Atr or Chek1, or overexpressing Cdc25 promotes regeneration, whereas Atr or Chek1 overexpression, or Cdc25 knockdown impedes regeneration. Inhibiting the Atr-associated checkpoint complex in neurons promotes regeneration and improves synapse/behavioral recovery after CNS injury. Independent of DNA damage, Atr responds to the mechanical stimulus elicited during regeneration, via the mechanosensitive ion channel Piezo and its downstream NO signaling. Sensory neuron-specific knockout of Atr in adult mice, or pharmacological inhibition of Atr-Chek1 in mammalian neurons in vitro and in flies in vivo enhances regeneration. Our findings reveal the Piezo-Atr-Chek1-Cdc25 axis as an evolutionarily conserved inhibitory mechanism for regeneration, and identify potential therapeutic targets for treating nervous system trauma.


Conflict of interest statement

The authors declare no competing interests.

Figures

Fig. 1
Fig. 1. The Atr/mei41-Chek1/grp pathway regulates axon regeneration in da sensory neurons in flies.
a Class III da neuron axons fail to regenerate in WT. Atr/mei41 removal as in mei4129D mutants or class III da neuron-specific RNAi leads to increased axon regeneration. Chek1/grpA196 mutant clones (with MARCM), class III da neuron expression of Chek1/grp RNAis, Cdc25/twe/stg, or the dephosphorylated/activated Cdk1.T14A.Y15F increases axon regeneration. Class III da neuron expression of twe RNAi suppressed the enhanced regeneration in mei4129D mutants. The injury site is demarcated by the dashed circle. Arrow marks axon stalling while arrowheads show the regrowing axon tips. b, c Quantifications of class III da neuron axon regeneration with regeneration percentage (b) and regeneration index (c). N = 72, 23, 30, 16, 22, 30, 36, 30, 37, and 28 neurons from 6 to 20 larvae. P = 0.0007, 0.003, 0.0007, 0.0177, 0.0013, <0.0001, 0.0002, 0.0008, 0.1818. d Class IV da neurons robustly regenerate in WT. Class IV da neuron-specific expression of hATR-WT, grp, hCHEK1, twe RNAis, or LOF of Cdk1 as in transheterozygotes of Cdk1B47/E1-23 impedes axon regeneration, whereas the kinase-dead (KD) mutant of hATR fails to show a significant effect. Overexpression of hATR-WT together with the constitutively active Cdk1 (T14A, Y15F) fails to inhibit axon regeneration. e, f Quantifications of class IV da neuron axon regeneration. N = 97, 50, 25, 30, 38, 33, 28, 24, and 23 neurons from 6 to 18 larvae. P = 0.0002, >0.9999, <0.0001, 0.0007, <0.0001, <0.0001, 0.0005, >0.9999. *P < 0.05, **P < 0.01, ***P < 0.001 by two-sided Fisher’s exact test (b and e), one-way ANOVA followed by Holm–Sidak’s test (c) or Dunn’s test (f). Scale bar = 20 μm. Source data are provided as a Source data file.
Fig. 2
Fig. 2. The Atr-Chek1 pathway regulates axon regeneration likely independent of DNA damage.
a The DNA damage marker, phosphorylated histone 2Agamma (p-His2Av), is not upregulated in injured class III da neurons (ddaF) at various time points, compared to the uninjured control (ddaA). The dashed teal circle marks the injury site and the cell bodies are outlined with dashed white lines. b The p-His2Av staining is quantified by normalizing the mean intensity in the injured class III da neuron (ddaF) to that of the neighboring uninjured class III da neuron (ddaA). No significant difference is observed at 5 min, 24 h, or 48 h AI. N = 8, 3, 9, and 7 neurons from 3 to 4 larvae. Data are presented as mean values +/− SEM. c Class III da neuron-specific expression of RNAis for His2Av, RpA-70, RPA2, or RPA3, RPA2KG00759 mutant clones (with MARCM) or RPA3G0241 mutants do not significantly increase axon regeneration. d, e Quantifications of class III da neuron axon regeneration with regeneration percentage (d) and regeneration index (e). N = 72, 14, 15, 24, 16, 20, 25, 24, 24, and 20 neurons from 4 to 20 larvae. The injury site is demarcated by the dashed circle. Arrow marks axon stalling. No statistical difference is detected by two-sided Fisher’s exact test (d), one-way ANOVA followed by Dunnett’s (b) and Holm–Sidak’s test (e). Scale bar = 20 μm. Source data are provided as a Source data file.
Fig. 3
Fig. 3. The Atr-associated checkpoint complex inhibits axon regeneration.
a TopBP1/mus101 and Hus1-like mutants, mus101A and Hus1-likeMI11259, and class III da neuron-specific expression of Atrip/mus304 RNAis, Rad17 RNAis, Rad1 RNAis, TopBP1/mus101 RNAi, or Claspin RNAis increase axon regeneration. The injury site is demarcated by the dashed circle. Arrow marks axon stalling while arrowheads show the regrowing axon tips. b The single-stranded DNA-damage pathway mediated by Atr, Chek1, Cdc25, and the associated checkpoint complex. The factors marked by the red cross are tested for their potential role in axon regeneration. c, d Quantifications of class III da neuron axon regeneration with regeneration percentage (c) and regeneration index (d). N = 72, 20, 27, 24, 30, 32, 29, 24, 23, 44, 29, 23, and 37 neurons from 6 to 20 larvae. P = 0.0002, <0.0001, <0.0001, <0.0001, 0.0007, 0.0005, <0.0001, <0.0001, <0.0001, 0.0002, 0.0447. *P < 0.05, **P < 0.01, ***P < 0.001 by two-sided Fisher’s exact test (c), one-way ANOVA followed by Dunn’s test (d), two-tailed unpaired Student’s t-test (d, P = 0.0191). Scale bar = 20 μm. Source data are provided as a Source data file.
Fig. 4
Fig. 4. Inhibiting components of the Atr-associated checkpoint complex promotes behavioral recovery after CNS injury in flies.
a Class III da neuron axon projection map in the VNC and the VNC injury paradigm. There is a segment-wise somatosensory map for gentle-touch: class III da neuron axons project into the VNC in an anterior-posterior pattern. Axons from the T1 segment constitute the anterior-most T1 bundle within the VNC. The T1 and T2 axon bundles are injured by targeting the nerve bundles right before they enter the commissure region, as marked by the red dots. Gentle-touch response is then performed by stimulating the T1 or T2 segments using an eyelash. A total of four trials are scored for each larva. PC, pseudocephalon; T, thoracic; A, abdominal. b mus101A mutants show enhanced gentle-touch response after VNC injury, as shown by the Recovery percentage. A larva is defined as showing recovery if the scores from at least two of the four trials are 1 or above. While WTs largely fail to respond even at 48 h AI, significantly more mus101A mutants show recovery as early as 24 h AI. P = 0.0013, 0.001. c Gentle-touch response scores at 8, 24, and 48 h AI with various stimulation intensities. Mus101A mutants display significantly higher recovery, especially with the T+++ stimulus. d Class III da neuron-specific knockdown of Rad17 mildly increases Recovery percentage at 48 h AI. P = 0.0176. e Class III da neuron-specific knockdown of Rad17 improves response scores at 48 h AI. f mei4129D mutation mildly increases Recovery percentage at 48 h AI. P = 0.0277. g mei4129D mutation improves response scores at 48 h AI. N = 41 larvae for Ctrl, 23 for mus101A, 33 for mei4129D, 11, 26, and 26 for Rad17 RNAi at 8, 24, and 48 h. Data are presented as mean values +/− SEM. *P < 0.05, **P < 0.01, ***P < 0.001 by two-sided Fisher’s exact test (b, d, and f), one-way ANOVA followed by Tukey’s test (c, e, and g). Source data are provided as a Source data file.
Fig. 5
Fig. 5. Inhibiting the Atr pathway promotes synapse regeneration in flies.
a Class III da neurons form cholinergic synapses in the VNC. Synaptotagmin-GFP (syt.eGFP/syt) marks class III da neuron presynapses, which are tightly opposed by postsynaptic cholinergic receptors labeled by α-bungarotoxin (α-BTX). Scale bar = 5 μm. b In uninjured class III da (C3da) neurons (marked in green), syt puncta (marked in red) are enriched at the presynaptic terminals within the neuropil. Scale bar = 20 μm. c Mus101A mutants show enhanced axon regeneration and synapse reformation in the CNS. Class III da neuron axon bundles on one side of the VNC are ablated (dashed circles), resulting in the retraction of axons out of the neuropil within 8 h AI. At 24 h AI, WT axons rarely regrow into the neuropil, displaying retraction bulb-like structures. Mus101A mutant class III da neurons not only exhibit extensive axon regeneration back into the neuropil, but also increase the percent of regenerating axons containing syt puncta at the terminals (arrowheads), indicative of synapse reformation. Two examples of mus101A mutants are shown. The schematic drawings depict the VNC (blue), neuropil (pink), uninjured axons (black), retracted axons (green), and regenerating axons (red). Scale bar = 20 μm. d Quantification of axon and synapse regeneration. N = 34 and 35 axon bundles from 8 and 10 larvae. The percent of regenerated axons increases from 21% in WT to 47% in mus101A mutants, P = 0.0406. *P < 0.05 by two-sided Fisher’s exact test. The percent of regenerated axon containing syt puncta is also increased in mus101A mutants. Source data are provided as a Source data file.
Fig. 6
Fig. 6. ATR’s response to osmotic stress depends on PIEZO1 and NOS.
ac Hypotonic stress-induced ATR clusters in the nucleus are attenuated in PIEZO1 knockout. a Exogenously expressed FLAG-ATR is present in the cytoplasm in both WT and PIEZO1KO HEK293T cells before treatment. 5 min or 7 min hypotonic stress induces robust clustering of FLAG-ATR in the nucleus in WT cells, which is much attenuated in the PIEZO1KO cells. Fewer cells produce the clusters. The clusters are smaller in size, fewer in number, and lower in intensity. The dashed circles outline the nucleus. Scale bar = 10 μm. b Quantification of the fluorescence intensity of FLAG-ATR normalized to GFP shows a reduction in PIEZO1KO cells. N = 4, 8, and 8 fields of view. c Quantification of the total area of FLAG-ATR clusters in the nucleus per cell is also reduced in PIEZO1KO cells. N = 36, 65, and 70 cells. df ATR clustering depends on NOS. d Hypotonic stress-induced ATR clusters in WT HEK293T cells are reduced by the NOS inhibitor 1400 W dihydrochloride, while histamine, a NOS activator, increases ATR clusters in PIEZO1KO cells. The dashed circles outline the nucleus. Scale bar = 10 μm. e Quantification of the fluorescence intensity of FLAG-ATR clusters. N = 8 fields of view. f Quantification of the total area of FLAG-ATR clusters in the nucleus per cell. N = 86, 94, 87, and 97 cells. Data are presented as mean values +/− SEM. *P < 0.05, **P < 0.01, ***P < 0.001 by two-way ANOVA followed by Sidak’s test (b and c), one-way ANOVA followed by Tukey’s multiple comparisons test (e and f). Source data are provided as a Source data file.
Fig. 7
Fig. 7. Atr/mei41 functions downstream of Piezo and Nos in inhibiting axon regeneration, and NO imaging.
a Genetic interaction and epistasis analyses among Piezo, Nos, and Atr/mei41. While class III da neuron axons in NosΔ15 heterozygotes, or transheterozygotes of PiezoKO and mei4129D (mei4129D/+; PiezoKO/+) behave similarly to WT, significant enhancement of regeneration is observed in transheterozygotes of NosΔ15 and mei4129D (mei4129D/+; NosΔ15/+). Class III da neuron-specific overexpression of grp in PiezoKO or NosΔ15 mutants reduces their regeneration enhancement phenotype. On the other hand, Class III da neuron-specific overexpression of mPiezo-TriM or Nos fails to suppress the regeneration enhancement in mei4129D mutants. The injury site is demarcated by the dashed circle. Arrow marks axon stalling while arrowheads show the regrowing axon tips. b, c Quantifications of class III da neuron axon regeneration with regeneration percentage (b) and regeneration index (c). N = 37, 8, 26, 24, 49, 31, 43, 22, 23, 22, and 27 neurons from 3 to 14 larvae. P = 0.4524, >0.9999, <0.0001, <0.0001, 0.0687, 0.0009, 0.0428, 0.0006, 0.0037, 0.0004. dg NO imaging in WT, NosΔ15 mutants, or PiezoKO at 48 h AI. d NO production is detected by DAF-FM diacetate. While in WT, NO is present around the injured axon tip, along the axon, and in the cell body, the fluorescence signal is drastically reduced in NosΔ15 mutants which lack the NO producing enzyme. e The NO fluorescence signal is similarly reduced in PiezoKO. The injury site is demarcated by the dashed circle. f NO fluorescence signal is rarely detected in uninjured control class III da neurons. At 48 h AI, 62.5% of the WT class III da neurons show obvious NO fluorescence signal, compared to 25% in PiezoKO or NosΔ15 mutants. g The mean NO fluorescence intensity measured at the growth cone tip is also significantly reduced in PiezoKO or NosΔ15 mutants. N = 8, 12, and 8 neurons from 3 to 4 larvae. Data are presented as mean values +/− SEM. *P < 0.05, **P < 0.01, ***P < 0.001 by two-sided Fisher’s exact test (b), one-way ANOVA followed by Holm–Sidak’s test (c), or Dunnett’s test (g). Scale bar = 20 μm. Source data are provided as a Source data file.
Fig. 8
Fig. 8. Inhibition of the Atr pathway by pharmacological inhibitors or conditional knockout promotes mammalian DRG neuron axon regeneration in vitro and in vivo, and axon outgrowth on substrates of differing stiffness.
ac Pharmacological inhibition of Atr or Chek1 modestly enhances axon regeneration of rat embryonic DRG neurons cultured in a microfluidic chamber, when applied after injury. a Inhibiting Atr with AZD6738 (0.5 µM), Chek1 with VE-822 (80 nM), or MK-8776 (0.2 µM) accelerates axon regeneration when imaged at 18 h AI. The axons are labeled with α-Gap43 staining. The dashed line marks the front of the axon tips in Control. b The axon coverage area is measured and normalized to the total width of the microgrooves. The values from the inhibitor-treated groups are further normalized to the corresponding DMSO vehicle control group in the same experiment. N = 5, 5, 5, and 7 experiments. c Enhanced axon regeneration is visible at 5 h AI when Atr is inhibited with AZD6738. The axons are labeled with α-Tuj1 staining. Scale bar = 100 µm. d Injection of the Chek1 inhibitor MK-8776 (final concentration: ~0.3 μM) into fly larvae right after injury enhances class III da neuron axon regeneration, compared to the PBS injected control. Arrow marks retracted axon tip and arrowheads mark the regenerating axon. Scale bar = 20 µm. e, f Quantifications of class III da neuron axon regeneration with regeneration percentage (e) and regeneration index (f). N = 23 and 24 neurons from 4 larvae. P = 0.0392, 0.0052. (g, h) Atr cKO enhances sensory axon regeneration in vivo. Analysis of regeneration of sensory axons by SCG10 immunostaining at SNL D3. Shown are sample images of regenerating sensory axons identified by SCG10 (g) and quantification (h). SCG10 immunofluorescence intensity was measured at different distal distances and normalized to that at the lesion site as the regenerative index. Dashed line marks the lesion site. Scale bar = 1 mm. N = 12 mice for each genotype. i, j Human CHEK1 overexpression in DRG neurons reduces sensory axon regeneration in vivo. Scale bar = 1 mm. N = 5 mice for each genotype. k, l Piezo1 cKO increases adult DRG neuron axon outgrowth on hydrogels of 0.3 and 1 kPa, but not 5 or 30 kPa. k Representative images of DRG neurons (stained with the α-Tuj1 antibody) grown on substrates of different stiffness. Scale bar = 50 µm. l Quantification of total neurite length normalized to that of the Control. All data points are normalized to the mean of the Control at 1 kPa. N = 37, 41, 67, 54, 31, 23, 29, and 34 neurons. P = 0.0188, 0.0104, 0.8871, 0.1567. m Atr cKO increases adult DRG neuron axon outgrowth on hydrogels of 0.3 kPa, but not 0.16, 1, 5, or 30 kPa. P = 0.2684, 0.0005, 0.6222, 0.4928, 0.2176. N = 28, 34, 73, 96, 161, 90, 78, 68, 26, and 22 neurons. Data are presented as mean values +/− SEM. *P < 0.05, **P < 0.01, ***P < 0.001 by two-sided Fisher’s exact test (e), one-way ANOVA followed by Holm–Sidak’s test (b), two-tailed unpaired Student’s t-test (f, i, and m), or Two-way ANOVA followed by Sidak’s test (h and j). Source data are provided as a Source data file.

Similar articles

Cited by

References

    1. Liu K, Tedeschi A, Park KK, He Z. Neuronal intrinsic mechanisms of axon regeneration. Annu Rev. Neurosci. 2011;34:131–152. doi: 10.1146/annurev-neuro-061010-113723. - DOI - PubMed
    1. Di Giovanni S. Molecular targets for axon regeneration: focus on the intrinsic pathways. Expert Opin. Ther. Targets. 2009;13:1387–1398. doi: 10.1517/14728220903307517. - DOI - PubMed
    1. Schwab ME, Strittmatter SM. Nogo limits neural plasticity and recovery from injury. Curr. Opin. Neurobiol. 2014;27:53–60. doi: 10.1016/j.conb.2014.02.011. - DOI - PMC - PubMed
    1. Tedeschi A, Bradke F. Spatial and temporal arrangement of neuronal intrinsic and extrinsic mechanisms controlling axon regeneration. Curr. Opin. Neurobiol. 2017;42:118–127. doi: 10.1016/j.conb.2016.12.005. - DOI - PubMed
    1. Mahar M, Cavalli V. Intrinsic mechanisms of neuronal axon regeneration. Nat. Rev. Neurosci. 2018;19:323–337. doi: 10.1038/s41583-018-0001-8. - DOI - PMC - PubMed

Publication types

MeSH terms