. 2021 Jun 22;22(1):465.
doi: 10.1186/s12864-021-07778-w.

Genome-wide expression and network analyses of mutants in key brassinosteroid signaling genes

Affiliations

Genome-wide expression and network analyses of mutants in key brassinosteroid signaling genes

Razgar Seyed Rahmani et al. BMC Genomics. .

Abstract

Background: Brassinosteroid (BR) signaling regulates plant growth and development in concert with other signaling pathways. Although many genes have been identified that play a role in BR signaling, the biological and functional consequences of disrupting those key BR genes still require detailed investigation.

Results: Here we performed phenotypic and transcriptomic comparisons of A. thaliana lines carrying a loss-of-function mutation in BRI1 gene, bri1-5, that exhibits a dwarf phenotype and its three activation-tag suppressor lines that were able to partially revert the bri1-5 mutant phenotype to a WS2 phenotype, namely bri1-5/bri1-1D, bri1-5/brs1-1D, and bri1-5/bak1-1D. From the three investigated bri1-5 suppressors, bri1-5/bak1-1D was the most effective suppressor at the transcriptional level. All three bri1-5 suppressors showed altered expression of the genes in the abscisic acid (ABA signaling) pathway, indicating that ABA likely contributes to the partial recovery of the wild-type phenotype in these bri1-5 suppressors. Network analysis revealed crosstalk between BR and other phytohormone signaling pathways, suggesting that interference with one hormone signaling pathway affects other hormone signaling pathways. In addition, differential expression analysis suggested the existence of a strong negative feedback from BR signaling on BR biosynthesis and also predicted that BRS1, rather than being directly involved in signaling, might be responsible for providing an optimal environment for the interaction between BRI1 and its ligand.

Conclusions: Our study provides insights into the molecular mechanisms and functions of key brassinosteroid (BR) signaling genes, especially BRS1.

Keywords: Arabidopsis; Brassinosteroid signaling; Expression analysis; Network analysis; Systems biology.


Conflict of interest statement

The authors declare that they have no competing interests.

Figures

Fig. 1
Fig. 1
Schematic overview of the BR signaling cascade and the results of this study. The figure provides a simplified scheme of BR signaling based on [4, 5]. ‌The genes studied in this work are indicated by a yellow star. Binding of BRs to the BRI1/BAK1 receptor triggers the phosphorylation/dephosphorylation signaling cascade that leads to the deactivation (dephosphorylation) of BIN2. The effects of BIN2 and BZR1/BES1 on BR-biosynthesis genes are depicted. The overlap between stress-response and BR response genes and the dual effect of BZR1/BES1 on stress response genes is also shown. The question marks indicate missing links that have been suggested based on the result of the present study. The hypothetical inferred role for BRS1 in providing a better condition for BRI/BAK1/BR binding by generating a more acidic environment is shown on the top right-hand side. The compensatory pathway resulting in the over-expressing expression of PP2C mediated by ABA is shown on the left-hand side. (Created with BioRender.com)
Fig. 2
Fig. 2
Root, hypocotyl, and epidermal cell length at seedling stage of plants used for expression profiling. Root (A), hypocotyl (B), and epidermal cell length (C) of WS2, bri1–5, bri1–5/brs1–1D, bri1–5/bak1–1D, and bri1–5/bri1–1D, measured 7 days after germination. For the root and hypocotyl length, the boxplot shows the distribution of data for 40 plants. For cell length, the bar represents the 95% confidence interval for the mean and the square indicates the location of the mean. Groups (different plant lines) were statistically compared by ANOVA and Tukey tests. Groups are ranked based on their significance level where “a” is representing the group with the highest mean and “d” the group with the lowest mean. Groups with different letters are significantly different
Fig. 3
Fig. 3
Differentially expressed genes (DEGs relative to WS2) being compared between bri1–5 and its three suppressors. Group A (restored genes, 270 genes): genes differentially expressed in the bri1–5 mutant but no longer in at least two of the suppressor lines; Group B (compensatory genes, 178 genes): genes that are differentially expressed in at least two suppressors but not in bri1–5; Group C (genes that were not restored, 371 genes): Genes that are aberrantly expressed in bri1–5 and at least two of the suppressor lines. Group D (333 genes), E (167), and F (94 genes) contain genes that are exclusively differentially expressed in respectively the bri1–5/brs1–1D, bri1–5/bri1–1D, and bri1–5/bak1–1D suppressor lines. The “core” below the number indicates the most reliable set for the group. The total number of potentially interesting genes is 1430
Fig. 4
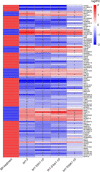
Fig. 4
Expression behavior of marker genes representative of downstream BR signaling pathways. Column BR treatment: colors indicate whether a gene was reported to be up (red) or down (blue) regulated according to literature upon treatment with exogenous BRs or in a line containing a gain-of-function mutation in a BR signaling gene. Genes were only selected as representative for downstream BR signaling if the up/down regulation of their expression was confirmed by at least 5 independent references and also affected in the bri1–5 line of our study (compared to WS2). Columns bri1–5, bri1–5/bri1–1D, bri1–5/brs1–1D, bri1–5/bak1–1 indicate whether the genes were found to be up or down-regulated compared to WS2 according to our expression data. Color scale indicates whether a gene is up-regulated (red), down-regulated (blue), or not differentially expressed (white). A * indicates that the adjusted p-value < 0.05
Fig. 5
Fig. 5
Subnetworks resulting from network analysis. Subnetworks identified by PheNetic representing different pathways that were identified by mapping and connecting the genes of group A (restored genes), B (compensatory genes), and C (not restored genes) on the interaction network. Node color: dark green, dark red, and dark blue indicate the core genes of groups A, B, and C, respectively. Likewise, the light green, light red, and light blue correspond to the non-core genes in groups A, B and C, respectively. Connector genes that were not identified as differentially expressed, but identified by PheNetic on the paths that connect the differentially expressed genes are shown in gray. Edge color: regulatory edges are shown in green, metabolic edges in red and protein-protein edges are shown in blue color
Fig. 6
Fig. 6
Comparing the mean expression values of BR-biosynthesis genes in the bri1–5 mutant and suppressor lines. For each line (WS2, bri1–5, and suppressors) the average log2 expression values of gene expression across replicates are given for the indicated BRs biosynthesis genes. The squares indicate the location of the mean and bars show the 95% confidence interval for the mean. The main BR-biosynthesis genes are affected in the bri1–5 mutant and all suppressors. However, the plots show that BR-biosynthesis genes are less affected in the line (bri1–5/bak1–1D) that best suppresses the bri1–5 phenotype. Pairwise comparisons between the average values were performed using Tukey’s post hoc test. Groups are ranked based on their significance mean where “a” is representing the group with the highest mean and “d” the group with the lowest mean. Groups indicated with different letters are significantly different
Fig. 7
Fig. 7
GO enrichment for differentially expressed genes (DEGs) exclusively in bri1–5/brs1–1D compared to WS2. The over-represented GO terms and DEG are shown on the x-axis and left-side y-axis, respectively. The green color shows the corresponding gene is present in the indicated GO term and white means it is not; “DE score” reflects the degree of log fold changes (differential expression compare to WS2); “Regulation” represents down (blue) and up (red) regulation for the corresponding gene. The small bottom heat map shows the significant over-representation value for GO terms based on the p-value in the hypergeometric test.

Similar articles

Cited by

References

    1. Clouse SD, Sasse JM. BRASSINOSTEROIDS: essential regulators of plant growth and development. Annu Rev Plant Physiol Plant Mol Biol. 1998;49(1):427–451. doi: 10.1146/annurev.arplant.49.1.427. - DOI - PubMed
    1. Noguchi T, Fujioka S, Choe S, Takatsuto S, Yoshida S, Yuan H, Feldmann KA, Tax FE. Brassinosteroid-insensitive dwarf mutants of Arabidopsis accumulate brassinosteroids. Plant Physiol. 1999;121(3):743–752. doi: 10.1104/pp.121.3.743. - DOI - PMC - PubMed
    1. Li J, Lease KA, Tax FE, Walker JC. BRS1, a serine carboxypeptidase, regulates BRI1 signaling in Arabidopsis thaliana. Proc Natl Acad Sci U S A. 2001;98(10):5916–5921. doi: 10.1073/pnas.091065998. - DOI - PMC - PubMed
    1. Gruszka D. The brassinosteroid signaling pathway-new key players and interconnections with other signaling networks crucial for plant development and stress tolerance. Int J Mol Sci. 2013;14(5):8740–8774. doi: 10.3390/ijms14058740. - DOI - PMC - PubMed
    1. Planas-Riverola A, Gupta A, Betegon-Putze I, Bosch N, Ibanes M, Cano-Delgado AI. Brassinosteroid signaling in plant development and adaptation to stress. Development. 2019;146(5). - PMC - PubMed

LinkOut - more resources