. 2021 Jun 21;12(1):3804.
doi: 10.1038/s41467-021-23510-4.

Genomic imprinting in mouse blastocysts is predominantly associated with H3K27me3

Affiliations

Genomic imprinting in mouse blastocysts is predominantly associated with H3K27me3

Laura Santini et al. Nat Commun. .

Abstract

In mammalian genomes, differentially methylated regions (DMRs) and histone marks including trimethylation of histone 3 lysine 27 (H3K27me3) at imprinted genes are asymmetrically inherited to control parentally-biased gene expression. However, neither parent-of-origin-specific transcription nor imprints have been comprehensively mapped at the blastocyst stage of preimplantation development. Here, we address this by integrating transcriptomic and epigenomic approaches in mouse preimplantation embryos. We find that seventy-one genes exhibit previously unreported parent-of-origin-specific expression in blastocysts (nBiX: novel blastocyst-imprinted expressed). Uniparental expression of nBiX genes disappears soon after implantation. Micro-whole-genome bisulfite sequencing (µWGBS) of individual uniparental blastocysts detects 859 DMRs. We further find that 16% of nBiX genes are associated with a DMR, whereas most are associated with parentally-biased H3K27me3, suggesting a role for Polycomb-mediated imprinting in blastocysts. nBiX genes are clustered: five clusters contained at least one published imprinted gene, and five clusters exclusively contained nBiX genes. These data suggest that early development undergoes a complex program of stage-specific imprinting involving different tiers of regulation.


Conflict of interest statement

The authors declare no competing interests.

Figures
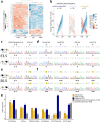
Fig. 1
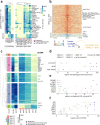
Fig. 1. Parent-of-origin-specific gene expression in blastocysts.
a Heatmap showing row-normalised expression values of all 105 blastocyst imprinted expressed (BiX) genes. Colour scale indicates Z-scores based on reads per million. Maternal and paternal reads for the same sample are shown in separate columns. b Distribution of SNP-containing RNA-seq reads in genetically distinguishable blastocysts on embryonic day 3.5 (E3.5). Comparisons are shown between maternal and paternal alleles in different gene groups [confirmed published imprinted genes (pubBsX), published unconfirmed imprinted genes, novel blastocyst imprint expressed (nBiX)]. Expression values were normalised to the maximum read count per gene and the mean of all replicates is shown. cf Electropherogram showing RT-PCR Sanger sequencing-based analysis of allele-specific expression of confirmed published imprinted genes Slc38a4 and Otx2 at E3.5 (c), of indicated nBiX genes at E3.5 (d), of confirmed published imprinted genes Slc38a4 and Otx2 at E6.5 (e) and of allele-specific expression of indicated nBiX genes at E6.5 (f). g Barplot showing tissue-specific gene enrichment for different gene groups (nBiX, nBsX, pubBsX, published unconfirmed and equivalently expressed genes), based on analysis with the R package TissueEnrich. FDR-adjusted p values were calculated using a hypergeometric test. Only tissues with a significant (adj. p < 0.05) enrichment in at least one group of genes are shown. *p < 0.05; **p < 0.01; ***p < 0.001; ns, not significant; n, number of genes belonging to each group that are present in the database used for tissue enrichment analysis. Source data are provided as Source Data files.
Fig. 2
Fig. 2. Identification of novel DMRs in uniparental embryos.
a Heatmap showing DNA methylation levels for 24 known germline DMRs (GL-DMRs) in blastocyst samples (left) and ESCs. Colour scale represents percentage of 5mC compared to 5C. b Heatmap showing DNA methylation signal in a 10 kb window around the centre of all 859 blastocyst DMRs identified in this work (red, maternal DNA methylation; blue, paternal DNA methylation). Known GL-DMRs are indicated rightmost. c Heatmap showing DNA methylation levels in all 859 blastocyst DMRs in our blastocyst samples compared to oocyte and sperm DNA methylation from published data. Hierarchical clustering was based on DNA methylation levels in gametes. d Distribution of blastocyst DMRs and known GL-DMRs over different genomic features. Gene promoters and 1,000 random sets of regions of comparable size and distribution (from all regions assessed in our DNA methylation analysis, grey) are shown for reference. e Locus overlap analysis of published ChIP-seq peaks for blastocyst DMRs and known GL-DMRs. f Motif enrichment analysis, for blastocyst DMRs and known GL-DMRs. Source data are provided as Source Data files.
Fig. 3
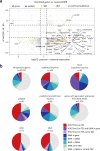
Fig. 3. Intersecting DMRs and allele-specific H3K27me3 with parental-allele-specific gene expression.
a Comparison of differential DNA methylation in uniparental blastocysts (y-axis) and parent-of-origin-specific gene expression (x-axis). Published and novel imprinted genes (nBiX and nBsX) are indicated in colour and other genes in grey. Each dot represents one gene associated with its closest DMR. Selected genes are labelled. b Pie charts representing all 10,743 genes whose expression was robustly detected, 134 published imprinted genes with expression data, 30 HCon repository imprints, 36 pubBsX genes, 98 published unconfirmed imprinted genes, 5,376 genes that are significantly biallelically expressed in blastocysts, 71 nBiX and 111 nBsX genes. Each chart indicates associations to different genomic features (DMRs and/or parent-of-origin-specific H3K27me3 on TSS). Distances from these genes to their nearest DMR are colour coded. Further colour codes indicate the presence of allele-specific H3K27me3 on the gene promoter (TSS ± 5 kb) or association with a DMR in the same topologically associating domain (TAD), independent of genomic distance. Source data are provided as Source Data files.
Fig. 4
Fig. 4. Correlation of gamete-specific H3K27me3 with parental-allele-specific gene expression.
a Heatmap showing associations between BsX genes and ICM-allele-specific or gamete-specific H3K27me3. Colour codes distinguish between allelic expression of BsX genes (maternal or paternal), allelic presence of H3K27me3 (on paternal or maternal alleles in the ICM, or in sperm and/or oocyte), and different gene groups (pubBsX, nBiX or nBsX genes). b Pie charts illustrating the occurrence of ICM allele-specific or gamete-specific H3K27me3 at the TSS of all 10,743 robustly detected transcripts. cd Pie charts illustrating the occurrence of allele- (in the ICM) or gamete-specific H3K27me3 at the TSS of maternally (c) or paternally (d) expressed nBiX, nBsX and pubBsX genes. Source data are provided as Source Data files.
Fig. 5
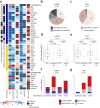
Fig. 5. Functional dependence of novel candidate genes on maternal H3K27me3 or maternal DNA methylation.
a Heatmap indicating allelic expression bias of BsX genes in wild-type (WT) morulae or morulae carrying maternal genetic deletions of either Dnmt3l (mDnmt3l KO) or Eed (mEed KO). Colours distinguish between pubBsX, nBiX and nBsX other than BiX genes. pubBsX genes are further divided into genes belonging to the high confidence (HCon) repository imprints or the published non-canonical imprint category (grey/black squares, black indicates membership to the specified category). Only genes with significant allelic bias (adj. p < 0.1, DESeq2) in at least one WT morula were included in the analysis (*, adj. p < 0.1; **, adj. p < 0.01; ***, adj. p < 0.001). Allelic expression bias is shown in the first two columns of each WT-mKO set (colour coded from red to blue). The third column of each WT-mKO pair indicates mKO induced changes in the allelic expression bias (colour coded from red to blue; *, adj. p < 0.05; **, adj. p < 0.01; ***, adj. p < 0.001). b, c Pie charts indicating gene numbers within respective groups (pubBsX (b) and nBsX (c)) losing parent-of-origin-specific expression following maternal deletion of either Dntm3l (dependent on mDnmt3l), Eed (dependent on mEed) or both (dependent on both) in morulae. Genes not dependent on either are also indicated. d, e Box plots illustrating how allelic ratio (absolute log2FC) of pubBsX (d) or nBsX (e) genes is affected by maternal deletion of Dnmt3l (mDnmt3l KO) or Eed (mEed KO) at the morula stage. Only genes with significant allelic bias (adj. p < 0.1) in at least one WT morula were included. Paired two-tailed Wilcoxon signed rank tests were performed for WT vs KO comparisons (WT-1 vs mDnmt3l KO and WT-2 vs mEed KO). Two-tailed Wilcoxon rank sum tests were performed to compare the two WT datasets (WT-1 vs WT-2) and the WT vs KO differences between datasets. p-values for individual comparisons are indicated in the Figure. All box plots show the 25th percentile, median and 75th percentile; whiskers indicate minimum and maximum values. f, g Bar charts indicating associations between functional response to loss of either mDnmt3l or mEed (as defined in Fig. 5b) with physical proximity to DMRs (within 250 kb or in the same TAD) or the presence of TSS-associated (±5 kb) H3K27me3 for pubBsX (f) and nBsX (g) genes. Source data are provided as Source Data files.
Fig. 6
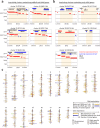
Fig. 6. Novel imprinting clusters and novel genes in known clusters.
a, b Close-up views of genomic features (genes, DMRs, allele-specific H3K27me3 and allele-specific TADs) for gene clusters containing published imprinted genes containing at least one nBsX gene (clusters 23-27) (a) and gene clusters containing only nBsX genes (clusters 28-32) (b). Red indicates maternal, and blue paternal allelic expression (genes quadrant; based on our data), maternal/paternal H3K27me3 (H3K27me3 quadrant; based on), maternal/paternal DMR (DMR quadrant; based on our data), maternal/paternal TAD (TAD quadrant; based on). Grey colour for specified genes indicates published imprinted genes for which parent-of-origin-specific expression was not confirmed; grey genes without gene names represent neighbouring genes not included in the cluster analysis. ncRNAs are indicated in italics. nBsX genes are indicated in bold. c Visualisation of chromosomal locations of imprinted genes and chromatin marks. Blastocyst DMRs are plotted as bars to the left in gold, known GL-DMRs are shown in blue. The density of tested regions (regions with reads in µWGBS) are plotted in grey. Parent-of-origin expression bias is shown on the right. nBiX and nBsX genes are plotted in gold and published imprinted genes in blue. The density of all robustly expressed genes is plotted in grey. All clusters of (a) and (b) and Supplementary Figs. 8a and b are indicated [blue, clusters 1–12 (published imprinted genes and at least one pubBsX gene); violet, clusters 13–22 (published imprinted genes with no evidence of parent-of-origin-specific expression in blastocysts); green, clusters 23–27 (published imprinted genes and containing at least one nBsX gene); yellow, clusters 28–32 (containing only nBsX genes)]. The locations of all allele-specific H3K27me3-associated promoters are indicated as red bands overlaid on the chromosome ideograms. Source data are provided as Source Data files.

Similar articles

Cited by

References

    1. Tucci V, Isles AR, Kelsey G, Ferguson-Smith AC, Erice Imprinting G. Genomic imprinting and physiological processes in mammals. Cell. 2019;176:952–965. doi: 10.1016/j.cell.2019.01.043. - DOI - PubMed
    1. Sanli I, Feil R. Chromatin mechanisms in the developmental control of imprinted gene expression. Int. J. Biochem. Cell Biol. 2015;67:139–147. doi: 10.1016/j.biocel.2015.04.004. - DOI - PubMed
    1. Surani MA, Barton SC, Norris ML. Development of reconstituted mouse eggs suggests imprinting of the genome during gametogenesis. Nature. 1984;308:548–550. doi: 10.1038/308548a0. - DOI - PubMed
    1. McGrath J, Solter D. Completion of mouse embryogenesis requires both the maternal and paternal genomes. Cell. 1984;37:179–183. doi: 10.1016/0092-8674(84)90313-1. - DOI - PubMed
    1. Morison IM, Ramsay JP, Spencer HG. A census of mammalian imprinting. Trends Genet. 2005;21:457–465. doi: 10.1016/j.tig.2005.06.008. - DOI - PubMed

Publication types