. 2021 Sep;112(9):3437-3454.
doi: 10.1111/cas.15033. Epub 2021 Jul 29.

PDL1-positive exosomes suppress antitumor immunity by inducing tumor-specific CD8+ T cell exhaustion during metastasis

Affiliations

PDL1-positive exosomes suppress antitumor immunity by inducing tumor-specific CD8+ T cell exhaustion during metastasis

Ji Chen et al. Cancer Sci. 2021 Sep.

Abstract

Metastasis is the main cause of death in individuals with cancer. Immune checkpoint blockade (ICB) can potentially reverse CD8+ cytotoxic T lymphocytes (CTLs) dysfunction, leading to significant remission in multiple cancers. However, the mechanism underlying the development of CTL exhaustion during metastatic progression remains unclear. Here, we established an experimental pulmonary metastasis model with melanoma cells and discovered a critical role for melanoma-released exosomes in metastasis. Using genetic knockdown of nSMase2 and Rab27a, 2 key enzymes for exosome secretion, we showed that high levels of effector-like tumor-specific CD8+ T cells with transitory exhaustion, instead of terminal exhaustion, were observed in mice without exosomes; these cells showed limited inhibitory receptors and strong proliferation and cytotoxicity. Mechanistically, the immunosuppression of exosomes depends on exogenous PD-L1, which can be largely rescued by pretreatment with antibody blockade. Notably, we also found that exosomal PD-L1 acts as a promising predictive biomarker for ICB therapies during metastasis. Together, our findings suggest that exosomal PD-L1 may be a potential immunotherapy target, suggesting a new curative therapy for tumor metastasis.

Keywords: exosomes; immune checkpoint blockade therapies; metastasis; predictive biomarker; tumor-specific CD8+ T exhaustion.


Conflict of interest statement

The authors declare no conflicts of interest.

Figures

FIGURE 1
FIGURE 1
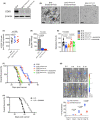
Melanoma‐released exosome is significantly increased as metastasis progression. To analysis the tumor‐released exosomes in metastasis, lung tissues were dissected out, digest, and then sorting melanoma cells for Ter119CD31CD45CD146+ using flow cytometry. These cells were cultured in vitro for 24 h followed with exosome purification by gradient centrifugation. A, Electron microscopy images of purified exosomes. B, ELISA to measure the levels of exosome isolated from mice (n = 5) on days 0, 3, 6, 9, 12 15, or 18. The levels shown are ng per 100 mg weight of lung tissue. C, Pearson correlation between the exosome level and tumor burden (number of metastases foci) in mice (n = 20). D, Sorted melanoma cells were treated with or without IFN‐γ, and then the levels of exosome were measured by ELISA on different days. In (B) and (D), the experiments were performed at least twice with similar results. Error bars, SEM
FIGURE 2
FIGURE 2
Tumor‐released exosome was critical promotor for metastasis. A, Western blot analysis of exosomes from WT, 2 mutated (Rab27a‐KD and nSMase2‐KD) B16 cells. B, Electron microscopy images of WT and Rab27a‐KD and nSMase2‐KD B16 cells, purified by gradient centrifugation. C, Number of CFSE‐labeled WT and Rab27a‐KD and nSMase2‐KD B16 cells present in the lungs of mice 2 h after administration. D, Melanoma cells were sorted from metastatic mice and were cultured in vitro, also shown as Figure 1. The levels of exosome purified from cultured supernatant were measured by ELISA (n = 4), shown as ng per 100 mg weight of lung tissue. E, WT B16 were injected with C57BL/6J mice, after 16‐18 d, exosomes were isolated from peripheral blood using an isolation kit. On days 6, 10, or 14, the purified exosomes were adoptively transferred to mice bearing knockdown B16 cells. The numbers of metastases foci of mice were counted under a dissection microscope on day 16. See also Figure S2C. F, Survival curve of control or metastatic mice treated with or without additional purified exosomes. WT vs Rab27a‐KD, P < .001; WT vs nSMase2‐KD, P < .001; WT vs Rab27a‐KD plus exosomes, P = .068; WT vs nSMase2‐KD plus exosomes, P = .062. log rank test was used. G, C57BL/6J mice were intravenously injected with B16‐luc cells. The inhibitor of exosome, GW4869, was performed as described in Materials and Methods from day 6 of tumor inoculation. Luciferin was administrated on days 0, 6, 12, and 18, and light emission was recorded. Representative bioluminescence images are shown; PBS, n = 7; GW4869, n = 9. Unpaired t test was used. H, Mouse survival curve following injection of LLC cells as in (F), control mice (n = 9) vs treated mice (n = 12), P < .001(log rank test). In (C‐E), one‐way ANOVA with Bonferroni correction was used. The experiments were performed at least twice with similar results. Error bars, SEM
FIGURE 3
FIGURE 3
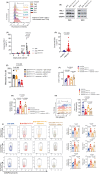
Exosomes derived from melanoma cells can induce tumor‐specific CD8+ T cell exhaustion. A, CD8−/− mice were injected with WT or Rab27a‐KD and nSMase2‐KD B16 cells. The numbers of metastases foci were counted on day 16, see Figure S3A. n = 8 for each group. One‐way ANOVA with Bonferroni correction was used. B, Survival curve of mice as shown in (A). WT vs Rab27a‐KD, P = .098; WT vs nSMase2‐KD, P = .104; log rank test was used. C, The fluorescence intensity of CFSE was measured in CD8+ T cells of spleen, metastatic lymph nodes (metLNs), and the tumor microenvironment (TME) by flow cytometry (FCM). For the schematic of experimental design
see Figure S3C. D, In vivo underlying effect evaluation of the exosome in CD8+ T cells in a murine metastasis tumor model. C57BL/6J mice were intravenously injected with WT or Rab27a‐KD B16‐OVA cells following OT‐I cells adoptive transfer. The absolute numbers of OT‐I cells in TME were calculated on different days of tumor inoculation. E‐H, C57BL/6J mice were intravenously inoculated with WT or Rab27a‐KD B16‐OVA cells (4 × 105) on day 0, and CD45.1+ OT‐I cells were adoptively transfer on the following day (n = 6 per group). On days 9 and 18, TILs were subjected to FCM. FCM quantification of percentage and absolute number of CD44+ KLRG1+ OT‐I cells (E); representative FCM staining (left) and summary (right) of PD‐1 expression by OT‐I cells (F); percentage of Ki67+ OT‐I cells (G); representative FCM staining (left) and summary (right) of granzyme B (Gzmb), tumor necrosis factor‐α (TNFα) and interferon‐γ (IFN‐γ) by OT‐I cells (H). I, OT‐I cells were sorted by FCM from mice, as described in (E), mixed with CFSE‐labeled B16‐OVA cells and adoptively transfer to CD8−/− mice. After 12 h, the levels of caspase3+ in tumor cells were measured by FCM. J, Pie chart of progenitor (TCF1+Tim3CX3CR1), effector‐like transitory (PD‐1+TCF1CX3CR1+) and terminal (PD‐1+TCF1CD101+) populations within OT‐I cells in TME in metastatic mice. K, Heatmap showing the differentially expressed genes of infiltrated CD44+ OT‐I cells derived from mice given WT or Rab27a‐KD B16‐OVA cells. The experiments were repeated at least twice with similar results. In (D‐H), an unpaired t test was used. Error bars, SEM
FIGURE 4
FIGURE 4
Exosomes drive tumor‐specific CD8+ T cell exhaustion through endogenous PD‐L1. A, Representative FCM staining for multiple inhibitor markers including Tigit, Lag‐3, 2B4, Tim‐3, PD‐1 on CD8+ T in TEM from B16 metastatic mice. B, Western blot analysis of CD63, PD‐L1 in the whole cell lysate (WCL) and purified exosomes (EOX) from WT, Rab27a‐KD, and nSMase2‐KD B16 cells. C, ELISA to measure the levels of exosomal PD‐L1 in plasma samples from metastatic mice (n = 5) on days 0, 6, 12, and 18. D, ELISA of PD‐L1 on exosomes in plasma samples from healthy people (n = 12) or patients with metastasis tumor (n = 47). Unpaired t test was used. E, Purified exosomes from tumor‐bearing mice were pretreated with isotype IgG or anti‐PD‐L1 antibodies (50 ng/well) in vitro, and then adoptively transfer to mice injected with nSMase2‐KD or Rab27a‐KD B16. A summary of metastases of mice on day 16 is shown. F‐I, C57BL/6J mice were intravenously inoculated with WT or Rab27a‐KD B16‐OVA cells (4 × 105) on day 0, and CD45.1+ OT‐I cells were adoptively transfer on next day (n = 4 per group). On days 6, 9, 12, 15, pretreatment of purified exosomes as described in (E) and then administrated to mice in vivo. After 16 d, TILs were subjected to FCM. See also Figure S4B. FCM quantification of absolute numbers of total OT‐I (F) and CD44+KLRG1+ OT‐I (G); representative FCM staining (left) and summary (right) of PD‐1 expression by OT‐I T cells (H); representative FCM staining (left) and summary (right) of Gzmb, TNFα and IFN‐γ by OT‐I cells (I). The experiments were performed at least twice with similar results. In (C, E‐I), one‐way ANOVA with Bonferroni correction was used. Error bars, SEM
FIGURE 5
FIGURE 5
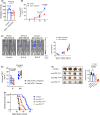
Exosomal PD‐L1 was a potential biomarker for predicting metastasis progression. A, C57BL/6J mice were treated with or without antibody targeted on PD‐L1 at 6, 9, and 12 d post‐WT B16 cells injection. A summary of metastases of mice is shown. n = 7 for each tumor group. B, Levels of PD‐L1 on exosomes in plasma samples of control or anti‐PD‐L1 antibody treatment mice, measured by ELISA. Unpaired t test was used in (A, B). Error bars, SEM. C, C57BL/6J mice were intravenously injected with B16‐luc cells on day 0. The anti‐PD‐L1 antibody was performed from day 4 (Group 1: on days 4, 7, 10), day 8 (Group 2: on days 8, 11, 14) or day 12 (Group 3: on days 12, 15, 17) of tumor inoculation. Luciferin was administrated on day 18, and light emission was recorded. Representative bioluminescence images are shown. The ratio of responder (R) or nonresponders (NR) for blockade was summary by bioluminescence intensity. n = 10 for each tumor group. D, Tumor‐bearing mice were treated with anti‐PD‐L1 antibody from day 8 (on days 8, 11, 14). ELISA to measure the levels of exosomal PD‐L1 in R and NR on day 7 and day 15 (paired t test). E, Images (left) and summary (right) of metastases of high (≥25 ng/mL), medium (between 5 and 25 ng/mL), and low PD‐L1 (≤5 ng/mL) on circulating exosomes. Each group of mice was administrated anti‐PD‐L1 blockade 3 times. One‐way ANOVA with Bonferroni correction was used. F, Mouse survival curve for high, medium, and low exosomal PD‐L1 of mice treated with anti‐PD‐L1 antibodies. Isotype antibody treatment mice served as the control. Control vs high, P = .874, Control vs medium, P = .004; Control vs low, P < .001(log rank test). The experiments were repeated at least twice with similar results

Similar articles

Cited by

References

    1. Valastyan S, Weinberg RA. Tumor metastasis: molecular insights and evolving paradigms. Cell. 2011;147:275‐292. - PMC - PubMed
    1. Minn AJ, Gupta GP, Siegel PM, et al. Genes that mediate breast cancer metastasis to lung. Nature. 2005;436:518‐524. - PMC - PubMed
    1. Obenauf AC, Massague J. Surviving at a distance: organ‐specific metastasis. Trends Cancer. 2015;1:76‐91. - PMC - PubMed
    1. Wong CW, Lee A, Shientag L, et al. Apoptosis: an early event in metastatic inefficiency. Cancer Res. 2001;61:333‐338. - PubMed
    1. Simoni Y, Becht E, Fehlings M, et al. Bystander CD8(+) T cells are abundant and phenotypically distinct in human tumour infiltrates. Nature. 2018;557:575‐579. - PubMed

MeSH terms