. 2021 Jun 22;144(5):1526-1541.
doi: 10.1093/brain/awab050.

Annexin A1 restores cerebrovascular integrity concomitant with reduced amyloid-β and tau pathology

Affiliations

Annexin A1 restores cerebrovascular integrity concomitant with reduced amyloid-β and tau pathology

Miriam Ries et al. Brain. .

Abstract

Alzheimer's disease, characterized by brain deposits of amyloid-β plaques and neurofibrillary tangles, is also linked to neurovascular dysfunction and blood-brain barrier breakdown, affecting the passage of substances into and out of the brain. We hypothesized that treatment of neurovascular alterations could be beneficial in Alzheimer's disease. Annexin A1 (ANXA1) is a mediator of glucocorticoid anti-inflammatory action that can suppress microglial activation and reduce blood-brain barrier leakage. We have reported recently that treatment with recombinant human ANXA1 (hrANXA1) reduced amyloid-β levels by increased degradation in neuroblastoma cells and phagocytosis by microglia. Here, we show the beneficial effects of hrANXA1 in vivo by restoring efficient blood-brain barrier function and decreasing amyloid-β and tau pathology in 5xFAD mice and Tau-P301L mice. We demonstrate that young 5xFAD mice already suffer cerebrovascular damage, while acute pre-administration of hrANXA1 rescued the vascular defects. Interestingly, the ameliorated blood-brain barrier permeability in young 5xFAD mice by hrANXA1 correlated with reduced brain amyloid-β load, due to increased clearance and degradation of amyloid-β by insulin degrading enzyme (IDE). The systemic anti-inflammatory properties of hrANXA1 were also observed in 5xFAD mice, increasing IL-10 and reducing TNF-α expression. Additionally, the prolonged treatment with hrANXA1 reduced the memory deficits and increased synaptic density in young 5xFAD mice. Similarly, in Tau-P301L mice, acute hrANXA1 administration restored vascular architecture integrity, affecting the distribution of tight junctions, and reduced tau phosphorylation. The combined data support the hypothesis that blood-brain barrier breakdown early in Alzheimer's disease can be restored by hrANXA1 as a potential therapeutic approach.

Keywords: ANXA1; Aβ; BBB; IDE; tau.


Figures

Figure 1
Figure 1
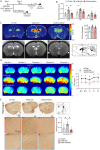
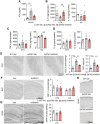
Blood–brain barrier permeability is increased in young 5xFAD mice and rescued by hrANXA1 treatment. (A) Schematic representation of acute treatment schedule of wild-type and 5xFAD mice with vehicle or hrANXA1 (0.67 µg/kg i.v.). (B) Quantification of Evans blue dye assay of blood–brain barrier permeability 24 h after hrANXA1 or vehicle treatment, normalized to serum dye content and brain tissue weight. Frontal cortex (CTX, n = 5–8), hippocampus (HC, n = 5–8), cerebellum (CRBL, n = 4–9). One-way ANOVA with post hoc Bonferroni multiple comparisons test. (C) Representative DCE-MRI derived images and quantification of relative contrast enhancement (RCE) in wild-type (WT) mice and 5xFAD mice 24 h after hrANXA1 or vehicle treatment (n = 5–7/group, average of two slices per mouse). T1-weighted multi-slice images were continuously acquired from 3 min before to 10 min after 100 μl Gd-DTPA (1 mmol/ml) intravenous injection at a rate of 0.6 ml/min. (D) Representative maps and quantification in the whole brain of repeated single slice CEST measurements at baseline (two measures) and at three time points after intravenous injection (0.15 ml/min) of 200 μl of 0.5 g/ml d-glucose solution in mice 24 h after hrANXA1 or vehicle treatment (n = 4/group). Units represent percentage CEST effect (0.8–2.2 ppm maps). Multiple t-tests corrected for multiple comparisons, adjusted P-values < 0.05 between 5xFAD vehicle (Veh) and 5xFAD hrANXA1 at all time points (asterisks). (E) Representative staining for fibrinogen and quantification in sagittal brain sections of wild-type mice and 5xFAD mice 24 h after hrANXA1 or vehicle treatment (n = 5–9 per group). One-way ANOVA followed by Tukey’s multiple comparisons test. Bars throughout represent mean ± SEM. *P < 0.05. Mouse brain atlas images were obtained from the Allen Institute website (www.alleninstitute.org).
Figure 2
Figure 2
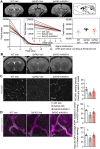
Neurovascular impairment in young 5xFAD mice is restored by hrANXA1 treatment. (A) Susceptibility-weighted MRI of wild-type and 5xFAD mouse brain 24 h after hrANXA1 or vehicle treatment showing vascular morphology. Arrow indicates microhaemorrhage. Histogram of SWI signal distribution (60 bins) ranging from 0 to 100 a.u. pixel values. Most heterogeneous distribution occurs in the interval of low pixel intensity values (highlighted region). Right: Denser distribution (150 bins) of the SWI signal covering an interval of pixel values from 0 to 5 a.u. (left). Pixel count analysis (right) shows a trend of increased number of low intensity pixels in vehicle 5xFAD treated mice compared to baseline (wild-type, WT). A trend of recovery to baseline values can be observed in the hrANXA1 5xFAD treated mice (n = 4–5 per group). (B) T2-weighted morphological MRI of mice 24 h after hrANXA1 or vehicle treatment. (C) Representative maximum z-projection images and quantification of PECAM1 vascular staining intensity in the cortex (n = 5/group, average value from 22 to 193 vessels/mouse, two to five sections stained per mouse, two images taken per section). (D) Representative maximum z-projection images and quantification of co-localization of anti-AQP4 [AQP4(4/18), white] and anti-pan-laminin (red) staining in the cortex of wild-type and 5xFAD mice 24 h after hrANXA1 or vehicle treatment. Proportion of co-localization (Mander’s overlap coefficients) in z-stacks was determined using ImageJ (n = 4–5 animals per group, two sections per animal). Bottom: Vascular AQP4 coverage (percentage of total laminin staining co-localizing with AQP4). Top: AQP4 localization on vessel (percentage of total AQP4 staining co-localizing with laminin). One-way ANOVA with post hoc Bonferroni multiple comparisons test. Bars represent mean ± SEM. *P < 0.05. Mouse brain atlas images were obtained from the Allen Brain Atlas (www.alleninstitute.org).
Figure 3
Figure 3
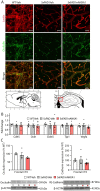
ANXA1 affects cellular distribution of tight junctions in 5xFAD mice. (A) Representative images of occludin (green) and lectin (red) staining in cortical sections that had undergone FASTClear of wild-type and 5xFAD mice treated with hrANXA1 or vehicle. (B) Quantification of qPCR analysis of mRNA expression of Cdh5 (VE-cadherin), Ocln (occludin), Cldn5 (Claudin 5), Tjp1 (ZO-1), and Vegfa (VEGF) in the frontal cortex of wild-type and 5xFAD mouse brain treated with hrANXA1 or vehicle (n = 5–6/group). (C) Quantification of protein expression of occludin and VE-Cadherin in cortical brain homogenates (n = 3–8 per group). Bars represent mean ± SEM. Mouse brain atlas images were obtained from the Allen Institute website (www.alleninstitute.org).
Figure 4
Figure 4
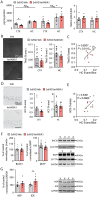
Acute hrANXA1 treatment reduces cortical amyloid-β40 pathology by increasing amyloid-β degradation in 5xFAD mice. (A) Left: ELISA analysis of amyloid-β40 and amyloid-β42 in the motor cortex (CTX) and hippocampus (HC) of 5xFAD mouse brain treated with hrANXA1 or vehicle, expressed as picograms per milligrams of protein (n = 6–7/group). Right: Ratio of amyloid-β42 and amyloid-β40 detected by ELISA in the motor cortex and hippocampus. Unpaired two-tailed t-test. (B) Representative images and quantification of percentage area of Thioflavin-S staining in the cortex (CTX) and hippocampus (HC) of 5xFAD mice treated with hrANXA1 or vehicle (n = 10–15 mice/group, mean of four to six sections analysed per mouse). (C) Scatter plot showing significant positive correlation between Evans blue dye content and Thioflavin-S staining percentage area in the hippocampus of 5xFAD mice acutely treated with 0.67 µg/kg hrANXA1 or vehicle at 3 months of age (n = 7–8/group, linear regression analysis, Pearson’s r = 0.6337, P =0.0112 (vehicle and ANXA1-treated). (D) Representative images and quantification of percentage area of anti-amyloid-β (6C3 antibody) in the cortex and hippocampus of 5xFAD mice treated with hrANXA1 or vehicle (n = 8–11 mice/group, mean of four to six sections analysed per mouse). (E) Scatter plot showing significant positive correlation between Evans blue dye content and 6C3 percentage area stained in the hippocampus of 5xFAD mice acutely treated with 0.67 µg/kg hrANXA1 or vehicle at 3 months of age (n = 5–6/group, linear regression analysis, Pearson’s r = 0.5401, P =0.086). (F) Representative western blots and quantitative analysis of β-secretase expression and β-CTFs levels in 5xFAD mice treated with hrANXA1 or vehicle. BACE1 expression in the motor cortex, normalized to β-actin (n = 9–10/group). β-CTF expression in the motor cortex, normalized to flAPP (n = 10/group). (G) Representative western blots and quantitative analysis of neprilysin (n = 6–7/group) and IDE expression (n = 6/group) in the motor cortex of 5xFAD mice treated with hrANXA1 or vehicle, normalized to GAPDH. Unpaired two-tailed t-test. Columns represent mean ± SEM. *P < 0.05.
Figure 5
Figure 5
Treatment with hrANXA1 reduced inflammatory markers and T-cell infiltration in brains of 5xFAD mice. (A) ELISA analysis of IFNγ expression in the serum of wild-type and 5xFAD mice treated with hrANXA1 or vehicle (n = 5-6). Kruskal-Wallis test with post hoc Dunn’s multiple comparisons test. (B) ELISA analysis of IL-10 in the cortex (CTX) (n = 6–9) and hippocampus (HC) (n = 5–6) of 5xFAD mice treated with hrANXA1 or vehicle. One-way ANOVA with post hoc Bonferroni multiple comparisons test. (C) ELISA analysis of TNFα in the cortex (CTX) (n = 4–9) and hippocampus (HC) (n = 4–6) of 5xFAD mice treated with hrANXA1 or vehicle. One-way ANOVA with post hoc Bonferroni multiple comparisons test. (D) ELISA analysis of IL-1β in the cortex (CTX) (n = 4–7) and hippocampus (HC) (n = 5–7) of 5xFAD mice treated with hrANXA1 or vehicle. One-way ANOVA with post hoc Bonferroni multiple comparisons test. (E) Representative images and quantification of percentage area covered of anti-CD3 staining (n = 4–6 mice/group, mean of one to three sections analysed per mouse) and CD3+ cell/µm2 (n =5–6 mice/group, mean of one to three sections analysed per mouse) in the subiculum of the hippocampus of wild-type and 5xFAD mice treated with hrANXA1 or vehicle. Kruskal-Wallis test with post hoc Dunn’s multiple comparisons test, or one-way ANOVA with post hoc Bonferroni multiple comparisons test. (F) Representative images and quantification of the percentage area of anti-Iba1 staining in the cortex and hippocampus of wild-type and 5xFAD mice treated with hrANXA1 or vehicle (n = 4 mice/group, mean of three to six sections analysed per mouse). (G) Representative images and quantification of the percentage area of anti-GFAP staining in the hippocampus of wild-type and 5xFAD mice treated with hrANXA1 or vehicle (n = 4 mice/group, mean of five to seven sections analysed per mouse). (H) Representative images of anti-GFAP staining in the cortex of wild-type and 5xFAD mice treated with hrANXA1 or vehicle. Bars represent mean ± SEM. *P < 0.05, **P < 0.01, ***P < 0.001.
Figure 6
Figure 6
Subchronic hrANXA1 treatment improves hippocampal-dependent memory in 5xFAD mice. (A) Schematic representation of subchronic treatment schedule of wild-type and 5xFAD mice with vehicle or hrANXA1 (1 µg/day i.p. for 7 days, red arrows) and behavioural testing (black arrows). (B) Freezing in context in which CS-US pair training was carried out, indicative of contextual memory (n = 6–9/group). A = acclimatization time before fear condition training; T = contextual testing. Ratio paired two-tailed t-test. (C) Freezing in novel context during acclimatization time of conditional test (A) and CS presentation (C), n = 5–9/group. Ratio paired two-tailed t-test. (D) Freezing in novel context during acclimatization time of conditional test (A) and trace interval (T), n = 5–9/group. Ratio paired two-tailed t-test. (E) Representative maximum z-projections of synaptophysin staining in the hilus of the dentate gyrus of wild-type and 5xFAD mice treated with hrANXA1 or vehicle. (F) Quantification of the percentage area of synaptophysin staining in the hilus of the dentate gyrus (DG) (n = 5 mice/group, mean of two sections analysed per mouse) and synaptophysin staining intensity in the dentate gyrus and CA1 and CA3 regions of the hippocampus (n = 5 mice/group, mean of two to five sections analysed per mouse) of wild-type and 5xFAD mice treated with hrANXA1 or vehicle. One-way ANOVA with Bonferroni multiple comparisons test. Bars represent mean ± SEM. *P < 0.05, **P < 0.01, ***P < 0.001, ****P < 0.0001
Figure 7
Figure 7
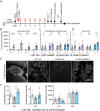
Treatment with hrANXA1 reduces tau phosphorylation and vascular disruption in Tau-P301L mice. (A) Brain Evans blue dye content measured in the frontal cortex and hippocampus of 7–8-month-old wild-type and tau P301L mice injected with Evans blue dye intravenously 24 h after acute intravenous treatment with hrANXA1 or vehicle. n = 5–7/group. One-way ANOVA. (B) Representative staining for fibrinogen and quantification in sagittal brain sections of wild-type (WT) mice and Tau-P301L mice 24 h after hrANXA1 or vehicle (Veh) treatment (n = 4–9 per group). (C) Representative confocal images shown as maximum z-projection images using ImageJ. All images are from an area of the hippocampus of wild-type, transgenic Tau-P301L and hrANXA1-treated Tau mice brains and were obtained with 63× oil objective using ZenPro. Scale bar = 20 µm. Figure shows immunofluorescence staining of endogenous IgG (green) and blood vessels with tomato lectin (red). (D) Z-stack FASTClear representative images showing staining of the vasculature in a Tau-P301L mouse. The top row displays results from a vehicle treated mouse, while the bottom row shows results from a mouse treated with hrANXA1. Magnification = ×20; scale bar = 100 µm. (E) Mice treated with hrANXA1 (n = 8) displayed a significant decrease in tau phosphorylation compared with the vehicle group (n = 6), in the motor cortex of Tau-P301L mice. Graphs represent density quantification of: AT8 upper band, AT8 lower, AT8 both bands, and representative western blot. Data were normalized to β-actin, and are plotted as mean ± SEM. Statistical analysis was conducted with a one-tailed Student’s independent t-test, * P < 0.05, ****P <0.001. (F) Western blot results for total tau showing that treatment with hrANXA1 (n = 8) caused no change in overall tau levels, compared with the vehicle group. Data were normalized to β-actin, and are plotted as mean ± SEM. Statistical analysis was conducted with a one-tailed Student’s independent t-test.

Similar articles

Cited by

References

    1. Polanco JC, Li C, Bodea L-G, et al.Amyloid-β and tau complexity - towards improved biomarkers and targeted therapies. Nat Rev Neurol 2018;14:22-39. - PubMed
    1. Sagare AP, Bell RD, Zlokovic BV.. Neurovascular dysfunction and faulty amyloid β-peptide clearance in Alzheimer disease. Cold Spring Harb Perspect Med. 2012;2:a011452. - PMC - PubMed
    1. Viggars AP, Wharton SB, Simpson JE, et al.Alterations in the blood brain barrier in ageing cerebral cortex in relationship to Alzheimer-type pathology: a study in the MRC-CFAS population neuropathology cohort. Neurosci Lett. 2011;505:25-30. - PubMed
    1. Bennett RE, Robbins AB, Hu M, et al.Tau induces blood vessel abnormalities and angiogenesis-related gene expression in P301L transgenic mice and human Alzheimer's disease. Proc Natl Acad Sci USA. 2018;115:E1289-E1298. - PMC - PubMed
    1. Montagne A, Zhao Z, Zlokovic BV.. Alzheimer’s disease: a matter of blood–brain barrier dysfunction? J Exp Med. 2017;46:3151-3169. - PMC - PubMed

Publication types