. 2021 May 5;24(6):102515.
doi: 10.1016/j.isci.2021.102515. eCollection 2021 Jun 25.

Propionate induces intestinal oxidative stress via Sod2 propionylation in zebrafish

Affiliations

Propionate induces intestinal oxidative stress via Sod2 propionylation in zebrafish

Qianwen Ding et al. iScience. .

Abstract

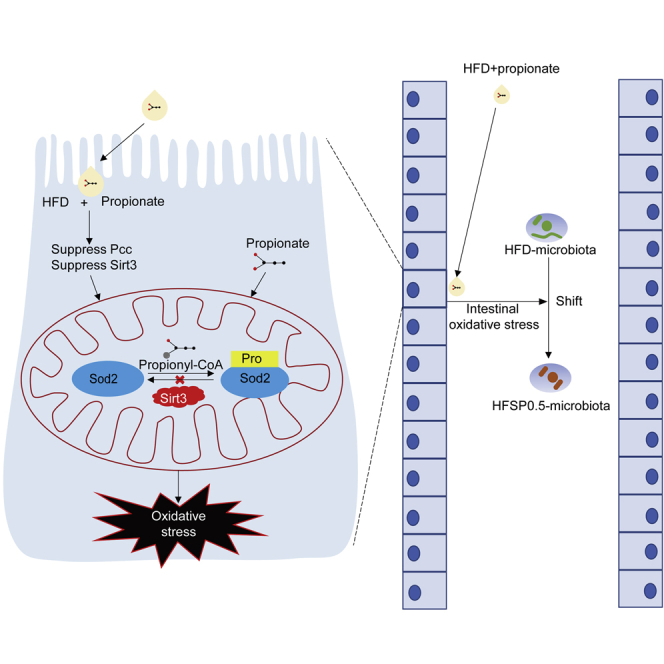
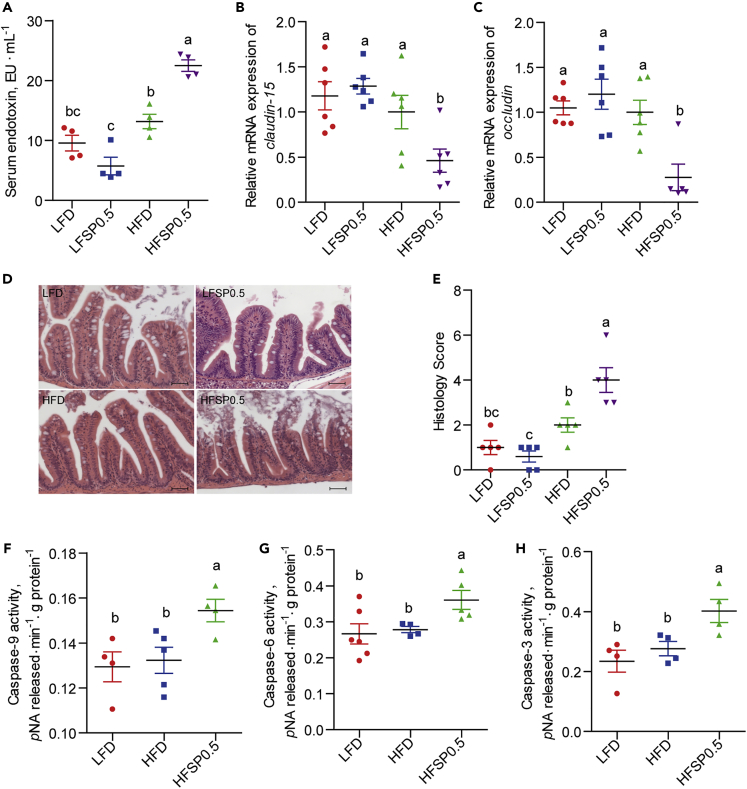
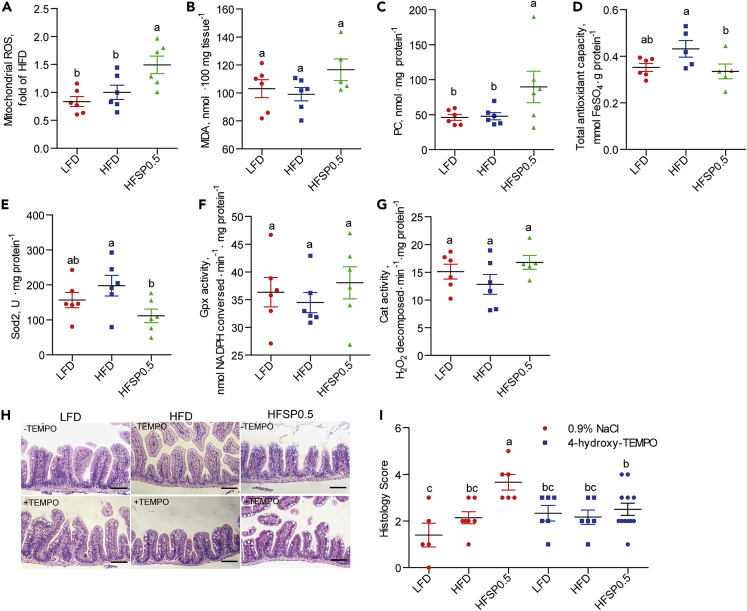
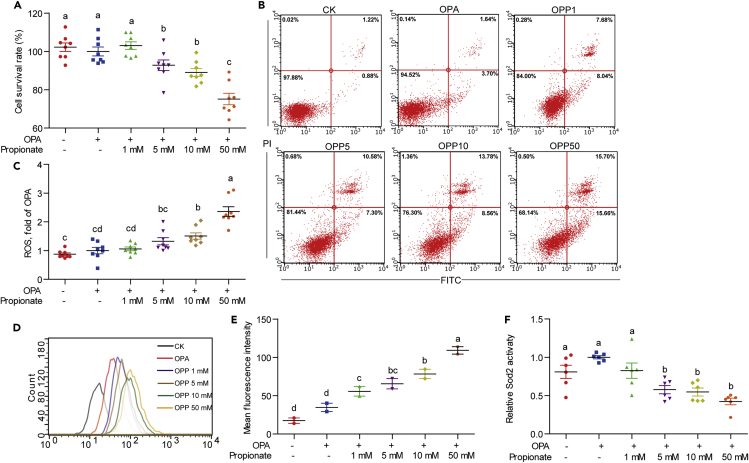
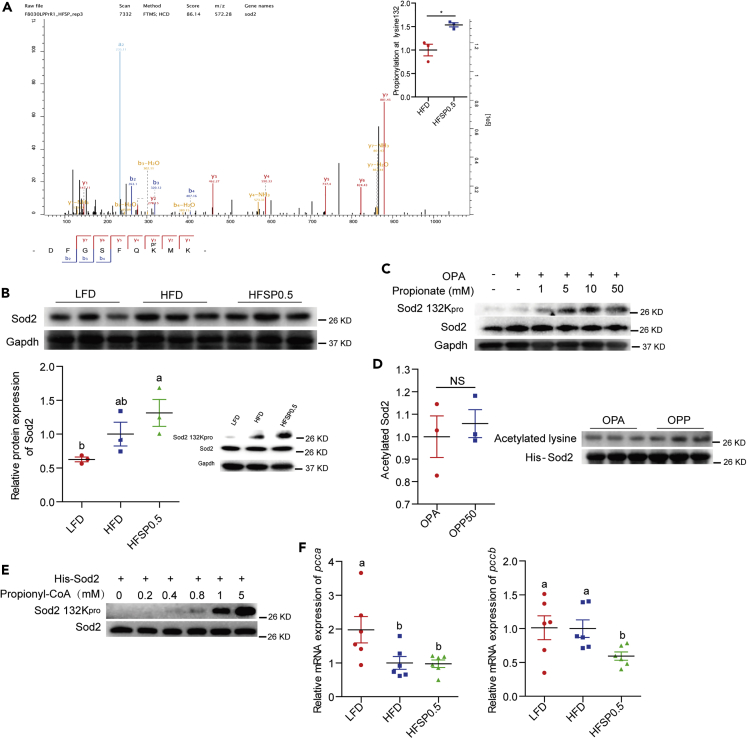
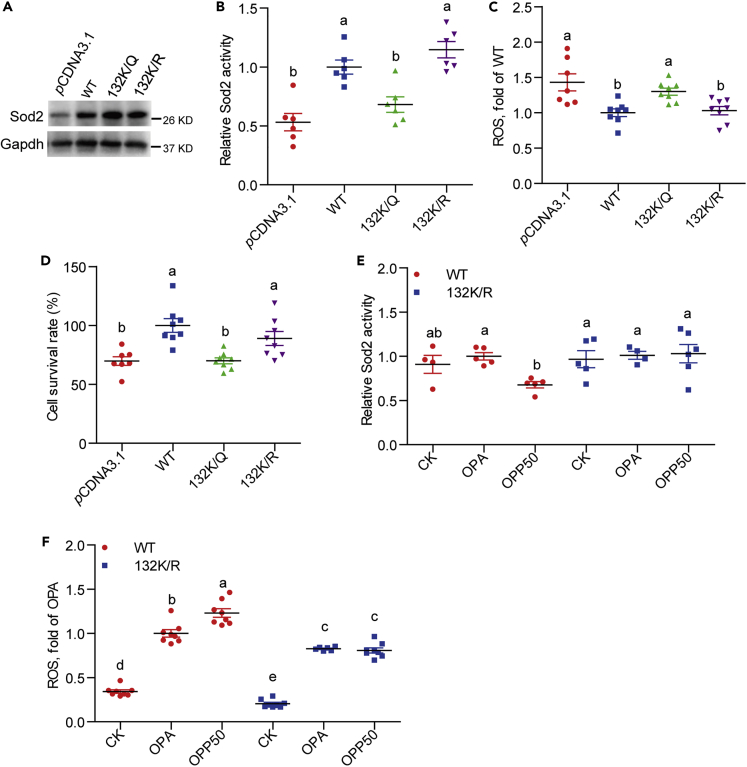
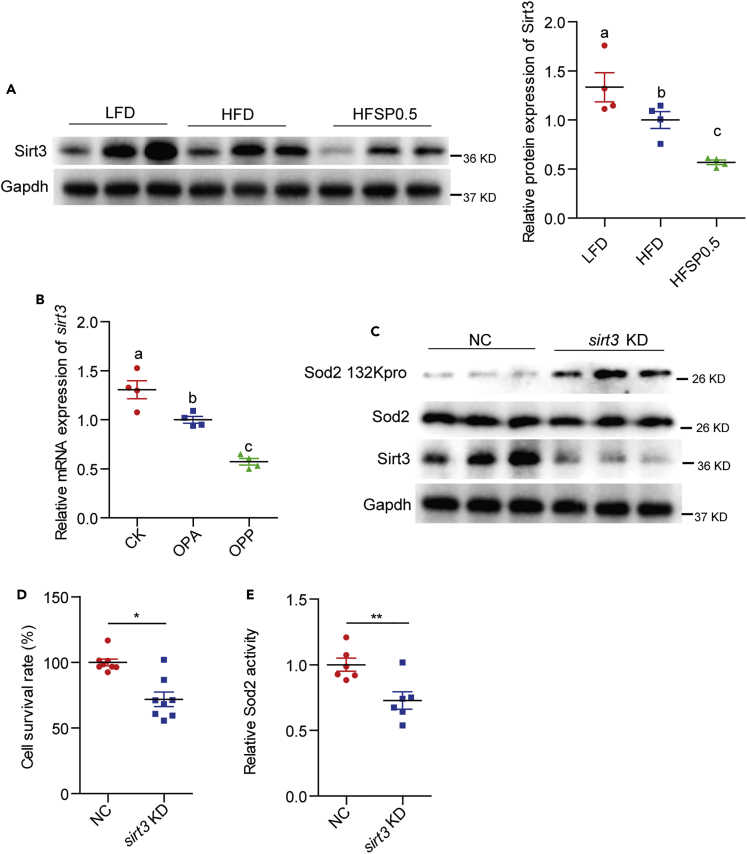
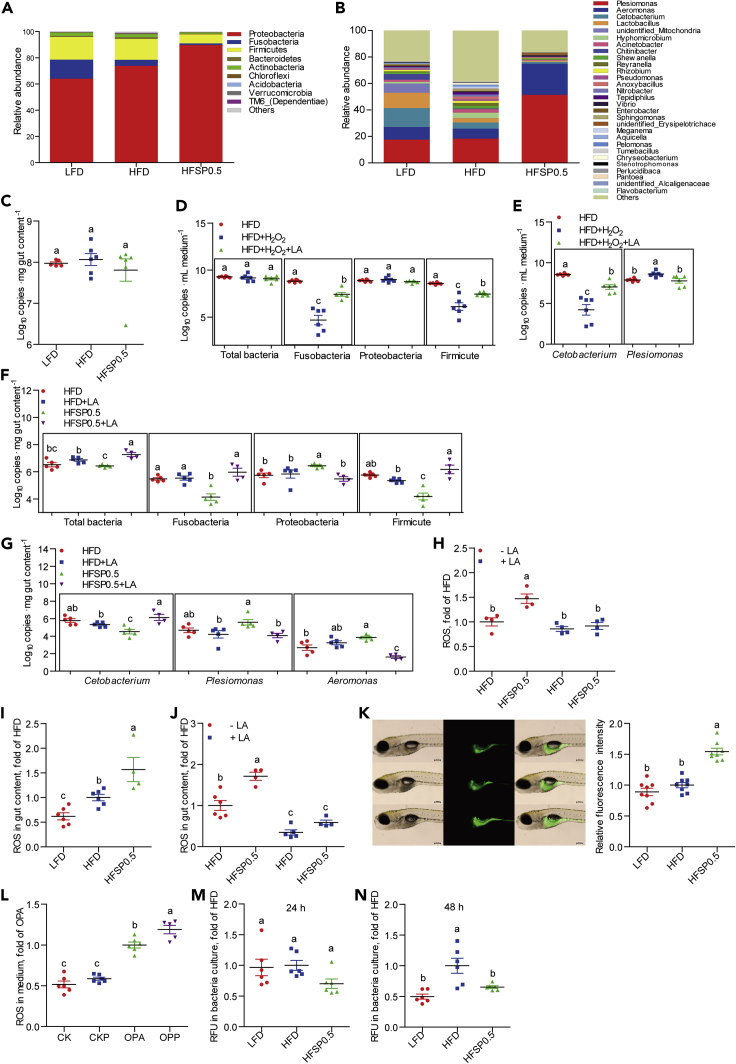
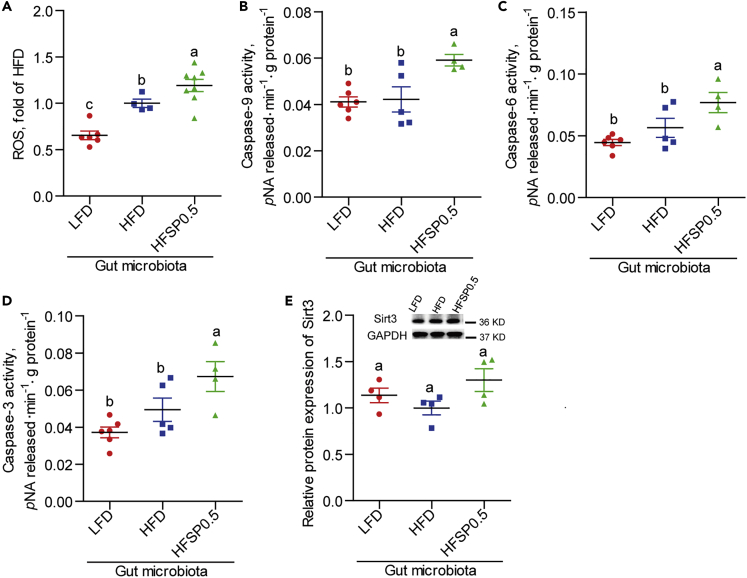
Propionate and propionyl-CoA accumulation have been associated with the development of mitochondrial dysfunction. In this study, we show that propionate induces intestinal damage in zebrafish when fed a high-fat diet (HFD). The intestinal damage was associated with oxidative stress owing to compromised superoxide dismutase 2 (Sod2) activity. Global lysine propionylation analysis of the intestinal samples showed that Sod2 was propionylated at lysine 132 (K132), and further biochemical assays demonstrated that K132 propionylation suppressed Sod2 activity. In addition, sirtuin 3 (Sirt3) played an important role in regulating Sod2 activity via modulating de-propionylation. Finally, we revealed that intestinal oxidative stress resulting from Sod2 propionylation contributed to compositional change of gut microbiota. Collectively, our results in this study show that there is a link between Sod2 propionylation and oxidative stress in zebrafish intestines and highlight the potential mechanism of intestinal problems associated with high propionate levels.

Keywords: Gastroenterology; cell biology; molecular physiology.


Conflict of interest statement

The authors declare no competing interests.

Figures

None
Graphical abstract
Figure 1
Figure 1
Propionate induces intestinal damage in the context of high-fat diet (A) Serum endotoxin in LFD-, LFSP0.5-, HFD-, and HFSP0.5-fed zebrafish at the end of the 2-week feeding trial (n = 4). (B and C) The relative mRNA expression of (B) claudin-15 and (C) occludin in the intestine of LFD-, LFSP0.5-, HFD-, and HFSP0.5-fed zebrafish at the end of 2-week feeding trial (n = 5–6). (D) Representative histopathologic image of H&E-stained intestinal sections. The scale bar, 50 μm. (E) Histological score measuring the severity of the intestinal damage of zebrafish (n = 5). (F–H) (F) Caspase-9, (G) caspase-6, and (H) caspase-3 activities in the intestine of 1-month-old zebrafish fed the LFD, HFD, or HFSP0.5 for 2 weeks (n = 4–6). Values are means ± SEM. Means without a common letter are significantly different (p < 0.05). Duncan's test. LFD, low-fat diet; LFSP0.5, 0.5% propionate-supplemented LFD; HFD, high-fat diet; HFSP0.5, 0.5% propionate-supplemented HFD. See also Figure 1, Figure 2, Figure 3, Figure 4, Figure 5, Figure 6, Figure 7, Figure 8and S2.
Figure 2
Figure 2
Propionate induces intestinal oxidative stress in the context of high-fat diet (A–C) Intestinal biomarkers for oxidative stress in 1-month-old zebrafish fed the LFD, HFD, or HFSP0.5 for 2 weeks, including (A) mitochondrial ROS, (B) MDA, and (C) PC. (D) Intestinal total antioxidant capability in 1-month-old zebrafish fed LFD, HFD, or HFSP0.5 for 2 weeks. (E–G) Intestinal antioxidant enzymes in 1-month-old zebrafish fed the LFD, HFD, or HFSP0.5 for 2 weeks, including (E) Sod2, (F) Gpx, and (G) Cat. (H) Representative histopathologic images of H&E-stained intestinal sections in zebrafish intraperitoneally injected with 4-hydroxy-TEMPO, a membrane-permeable radical scavenger. The scale bar, 50 μm. (I) Histological score measuring the severity of the intestinal damage of zebrafish intraperitoneally injected with 4-hydroxy-TEMPO. Values are means ± SEM (n = 5–12). Means without a common letter are significantly different (p < 0.05). Duncan's test. See also Figure S3.
Figure 3
Figure 3
ZF4 cell model validating the cytotoxicity of propionate and its role on Sod2 activity (A) Cell survival rate in ZF4 cells treated with OPA or a mixture of OPA with increasing concentrations of propionate for 24 h (n = 8). (B) Representative plot of cell apoptotic rate in ZF4 cells treated with OPA or a mixture of OPA with increasing concentrations of propionate (OPP1, OPP5, OPP10, and OPP50) for 24 h. (C) Relative amount of cellular ROS acquired by a fluorescence microplate reader between ZF4 cells treated with OPA or a mixture of OPA with increasing concentrations of propionate for 24 h (n = 8). (D) DCFH-DA histogram acquired by flow cytometry between ZF4 cells treated with OPA or mixtures of OPA with increasing concentrations of propionate for 24 h. (E) Mean fluorescence intensity of DCFH-DA in ZF4 cells treated with OPA or a mixture of OPA with increasing concentrations of propionate for 24 h (n = 2). (F) Sod2 activity in ZF4 cells treated with OPA or a mixture of OPA with increasing concentrations of propionate for 24 h (n = 6). Values are means ± SEM. Means without a common letter are significantly different (p < 0.05). Duncan's test.
Figure 4
Figure 4
Propionate contributes to Sod2 propionylation at 132 lysine site in zebrafish fed high-fat diet (A) HPLC-MS/MS spectra of an Sod2 peptide bearing propionylation (DFGSFQK+57.0901MN). (B) A representative western blotting showing patterns of Sod2 expression and Sod2 propionylation at the K132 and quantification of intestinal Sod2 protein level in zebrafish fed LFD, HFD, or HFSP0.5 for 2 weeks (n = 3). (C) A representative western blotting showing patterns of Sod2 expression and Sod2 propionylation at the K132 in ZF4 cells treated with OPA or OPP. (D) Western blotting showing the pattern of his-Sod2 acetylation purified from OPA- or OPP-treated HEK293 cells (n = 3). (E) A representative western blotting showing the pattern of his-Sod2 propionylation at K132 incubated with the indicated concentrations of propionyl-CoA. (F) The mRNA expression of genes encoding subunits of intestinal Pcc, an enzyme catalyzing the carboxylation of propionyl-CoA, in zebrafish fed HFD or HFSP0.5 for 2 weeks (n = 6). Values are means ± SEM. A and D were analyzed by Student's t test, ∗, p < 0.05, NS, not significant. B and F were analyzed by Duncan's test and means without a common letter are significantly different (p < 0.05). See also Figure S4.
Figure 5
Figure 5
Sod2 propionylation at 132 lysine site accounts for cellular ROS increase (A) A representative western blotting showing that overexpression of WT Sod2 and Sod2 K132R/Q compensated Sod2 level in ZF4 cells (with endogenous Sod2 knockdown). (B–D) (B) Sod2 activity, (C) ROS level, and (D) cell survival rate in ZF4 cells transfecting with WT Sod2 or Sod2 K132R/Q mutants (with endogenous Sod2 knockdown) (n = 6–8). (E) Sod2 activity and (F) ROS level in ZF4 cells treated with OPA or OPP (50 mM propionate), which were transfected with WT Sod2 and Sod2 K132R in advance (without Sod2 knockdown) (n = 4–8). Values are means ± SEM. Means without a common letter are significantly different (p < 0.05). Duncan's test. CK, 5% BSA. See also Figures S5 and S6.
Figure 6
Figure 6
Inhibition of Sirt3 promotes Sod2 propionylation (A) A representative western blotting showing Sirt3 expression and quantification of intestinal Sirt3 protein level in zebrafish fed LFD, HFD, or HFSP0.5 for 2 weeks (n = 4). (B) The mRNA expression of sirt3 in ZF4 cells treated with OPA or OPP50 for 24 h (n = 4). (C) A representative western blotting showing the propionylation of Sod2 at the 132 lysine site in ZF4 cells upon sirt3 knockdown. (D) Cell survival rate in ZF4 cells with sirt3 knockdown (n = 8). (E) Sod2 activity in ZF4 cells with sirt3 knockdown (n = 6). Values are mean ± SEM. A and B were analyzed by Duncan's test, and means without a common letter are significantly different (p < 0.05). D and E were analyzed by Student's t test, ∗, p < 0.05, ∗∗, p < 0.01. See also Figures S7 and S8.
Figure 7
Figure 7
Alteration of gut microbiota is linked to intestinal oxidative stress induced by propionate supplementation in HFD (A) The composition of gut microbiota at phylum level in 1-month-old zebrafish fed the LFD, HFD, or HFSP0.5 (n = 6). (B) The composition of gut microbiota at genus level in 1-month-old zebrafish fed the LFD, HFD, or HFSP0.5 (n = 6). (C) The number of total bacteria in gut content collected from 1-month-old zebrafish fed the LFD, HFD, or HFSP0.5 (Log10 16S rDNA gene copies . mg gut content−1) (n = 6). (D) The number of total bacteria, Fusobacteria, Proteobacteria, and Firmicutes after incubation in GAM with or without H2O2 for 48 h (Log10 16S rDNA gene copies . mL medium−1) (n = 6). (E) The number of Cetobacterium and Plesiomonas after incubation in GAM with or without H2O2 for 48 h (n = 6). (F) The number of total bacteria, Fusobacteria, Proteobacteria, and Firmicutes in gut content collected from 1-month-old zebrafish fed HFSP0.5 with or without supplementation of LA (Log10 16S rDNA gene copies . mg gut content−1) (n = 4–5). (G) The numbers of Cetobacterium, Plesiomonas, and Aeromonas in gut content collected from 1-month-old zebrafish fed HFSP0.5 with or without supplementation of LA (Log10 16S rDNA gene copies . mg gut content−1) (n = 4–5). (H) ROS level in the intestine collected from zebrafish fed the HFD or HFSP0.5 supplemented with LA (n = 4). (I) ROS level in the gut content collected from zebrafish fed the LFD, HFD, or HFSP0.5 (n = 4–6). (J) ROS level in gut contents collected from zebrafish fed the HFD or HFSP0.5 supplemented with LA (n = 4–6). (K) ROS pattern in GF zebrafish fed the LFD, HFD, or HFSP0.5 for 1 week. The scale bar, 200 μm (n = 8). (L) ROS level in the medium of ZF4 cells treated with OPA or OPP (50 mM propionate) for 24 h (n = 6). (M and N) ROS generated by in vitro cultured gut microbiota derived from LFD-, HFD-, or HFSP0.5-fed zebrafish at (M) 24 h and (N) 48 h (n = 6). Values are means ± SEM. Means without a common letter are significantly different (p < 0.05). Duncan's test.
Figure 8
Figure 8
Gut microbiota indirectly activate mitochondrial death pathway (A) The ROS level in GF zebrafish colonized with gut microbiota from 1-month-old zebrafish fed the LFD, HFD, or HFSP0.5 (n = 4–8). (B–D) (B) Caspase-9, (C) caspase-6, and (D) caspase-3 activities in GF zebrafish colonized with gut microbiota from 1-month-old zebrafish fed the LFD, HFD, or HFSP0.5 (n = 4–6). (E) Quantification of Sirt3 protein level in GF zebrafish transferred with gut microbiota from 1-month-old zebrafish fed the LFD, HFD, or HFSP0.5 (n = 4). Values are means ± SEM. Means without a common letter are significantly different ( p < 0.05). Duncan's test.

Similar articles

Cited by

References

    1. Asimakis G.K., Lick S., Patterson C. Postischemic recovery of contractile function is impaired in SOD2(+/-) but not SOD1(+/-) mouse hearts. Circulation. 2002;105:981–986. - PubMed
    1. Bhattacharyya A., Chattopadhyay R., Mitra S., Crowe S.E. Oxidative stress: an essential factor in the pathogenesis of gastrointestinal mucosal diseases. Physiol. Rev. 2014;94:329–354. - PMC - PubMed
    1. Bhatti J.S., Bhatti G.K., Reddy P.H. Mitochondrial dysfunction and oxidative stress in metabolic disorders - a step towards mitochondria based therapeutic strategies. Biochim. Biophys. Acta Mol. Basis Dis. 2017;1863:1066–1077. - PMC - PubMed
    1. Bheda P., Wang J.T., Escalante-Semerena J.C., Wolberger C. Structure of Sir2Tm bound to a propionylated peptide. Protein Sci. 2011;20:131–139. - PMC - PubMed
    1. Chen Y., Sprung R., Tang Y., Ball H., Sangras B., Kim S.C., Falck J.R., Peng J., Gu W., Zhao Y. Lysine propionylation and butyrylation are novel post-translational modifications in histones. Mol. Cell Proteomics. 2007;6:812–819. - PMC - PubMed

LinkOut - more resources