. 2021 May 31:15:678385.
doi: 10.3389/fnana.2021.678385. eCollection 2021.

Developmental Differences in Neocortex Neurogenesis and Maturation Between the Altricial Dwarf Rabbit and Precocial Guinea Pig

Affiliations

Developmental Differences in Neocortex Neurogenesis and Maturation Between the Altricial Dwarf Rabbit and Precocial Guinea Pig

Mirjam Kalusa et al. Front Neuroanat. .

Abstract

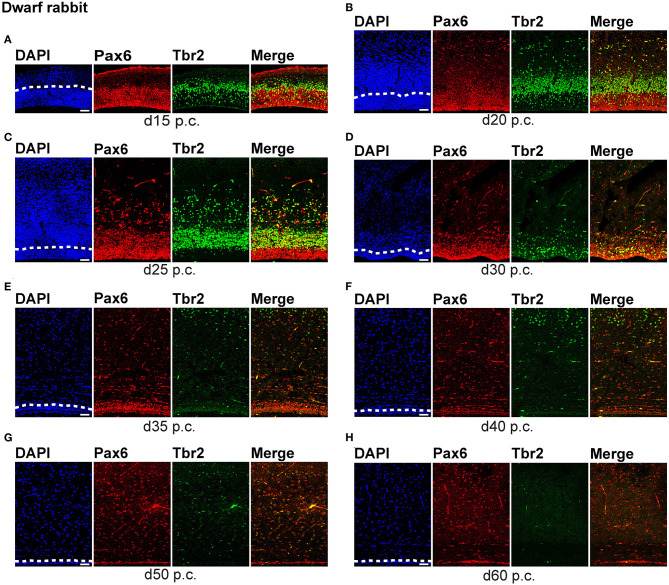
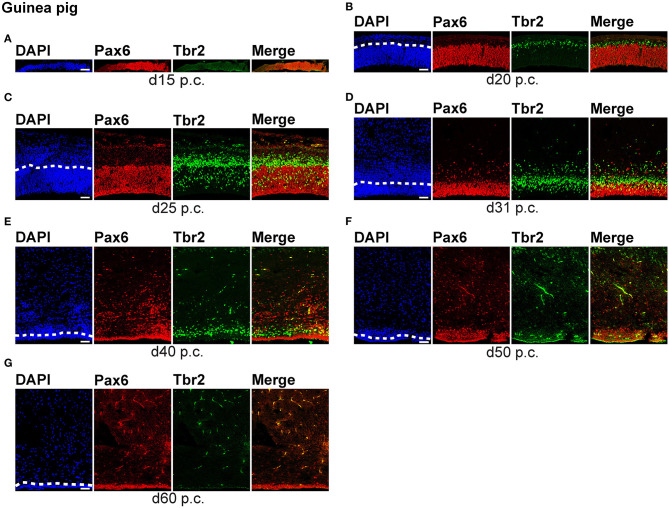
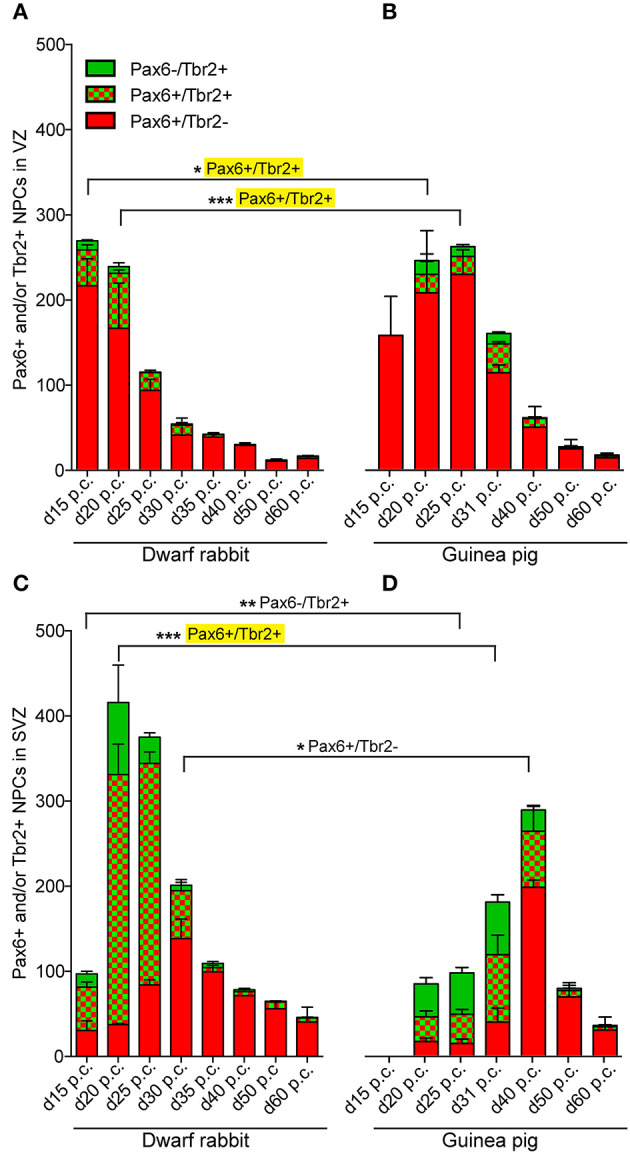
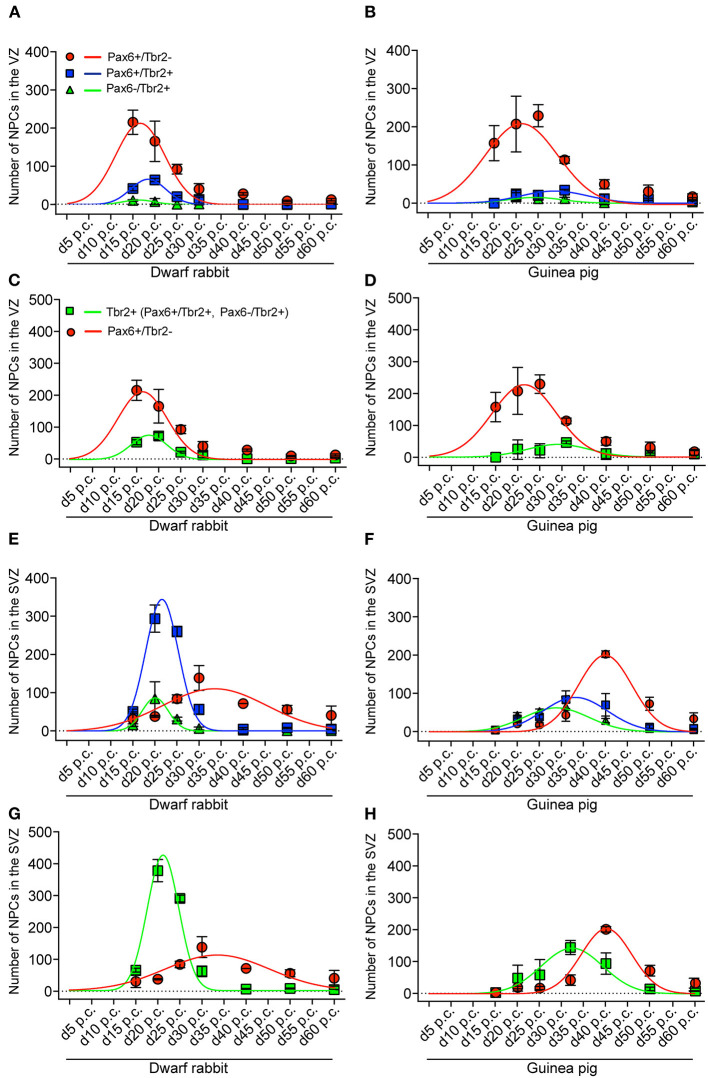
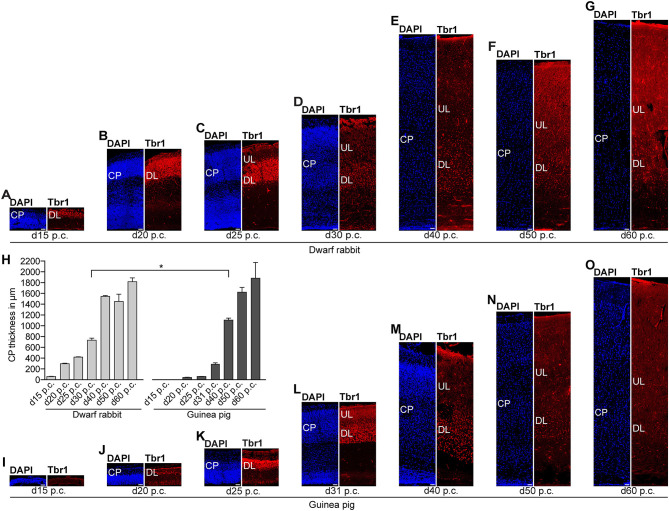
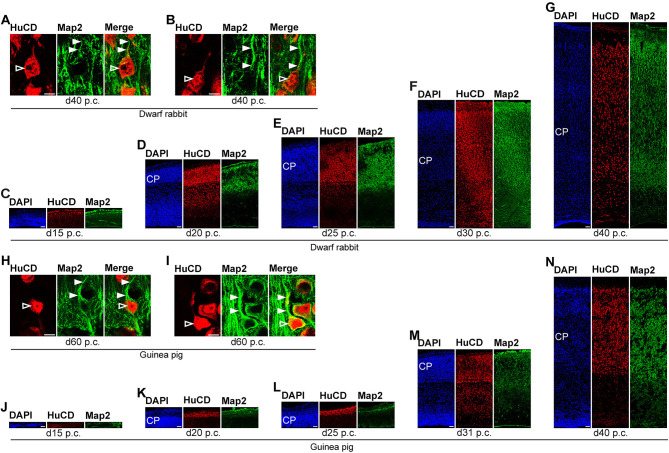
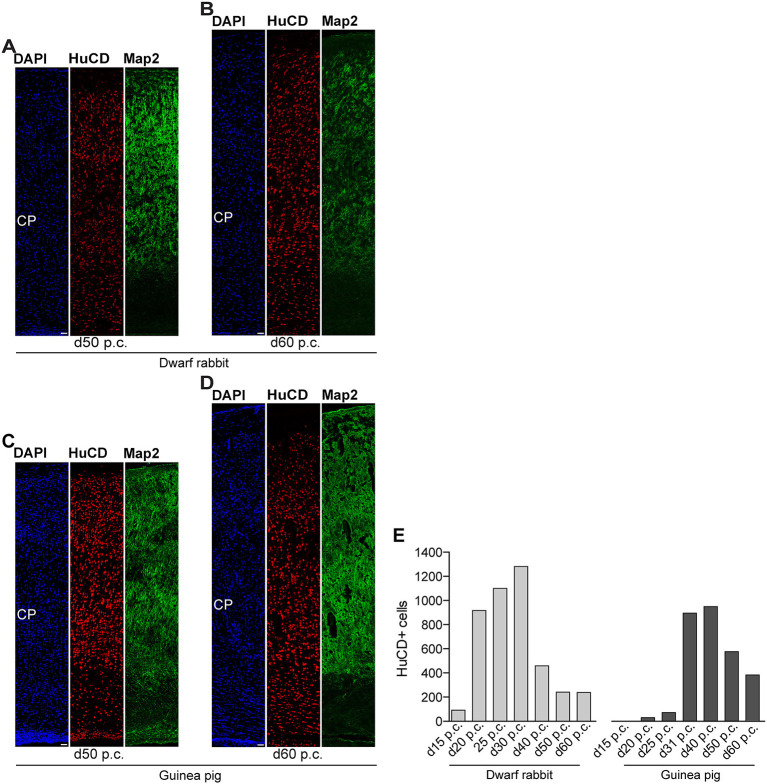
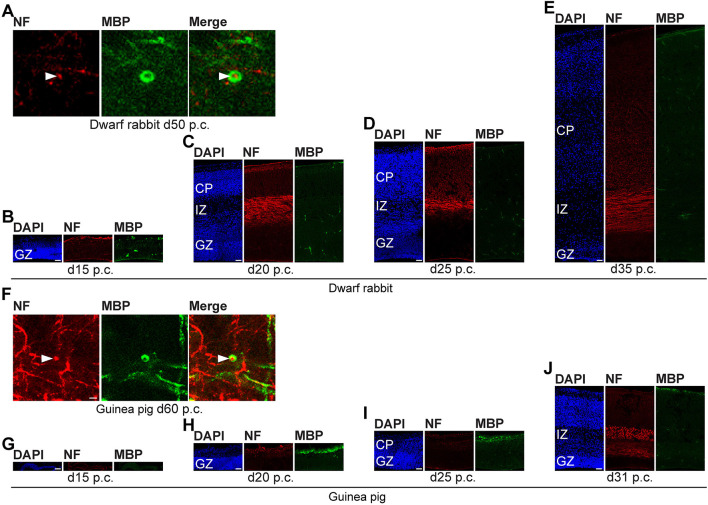
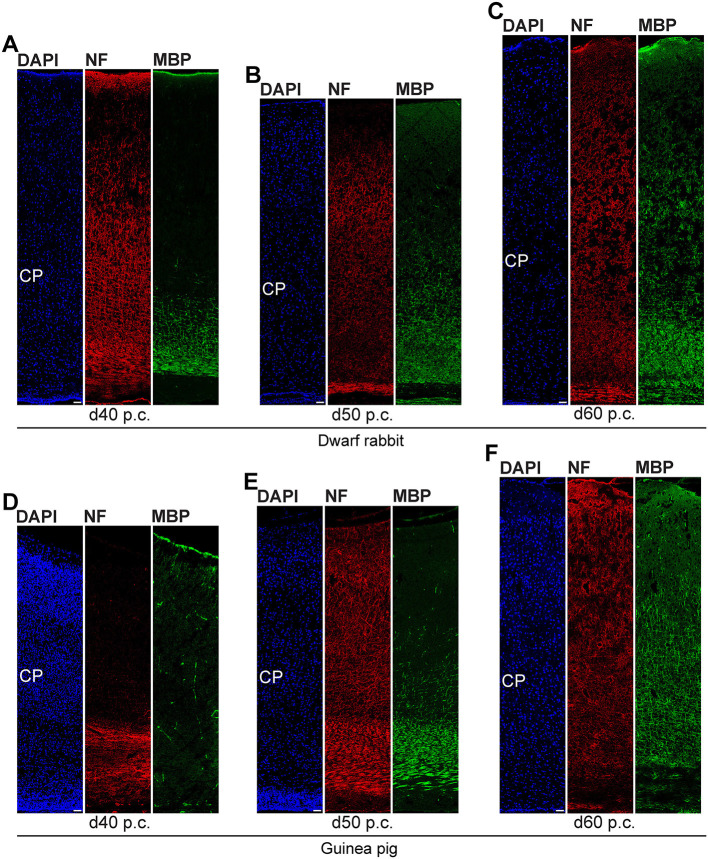
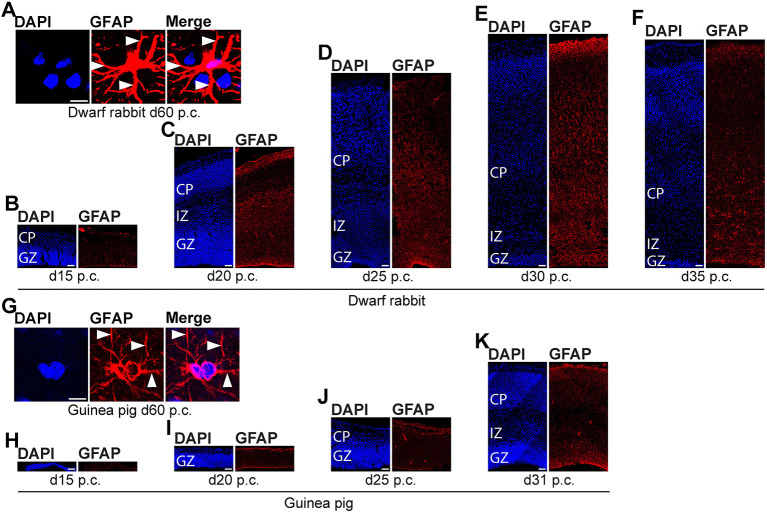
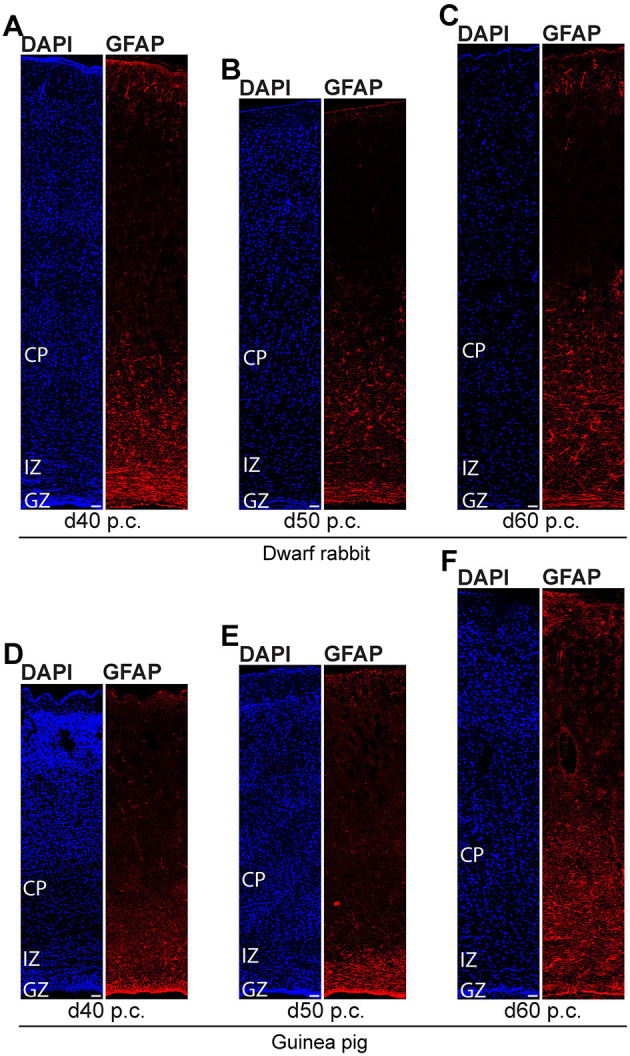
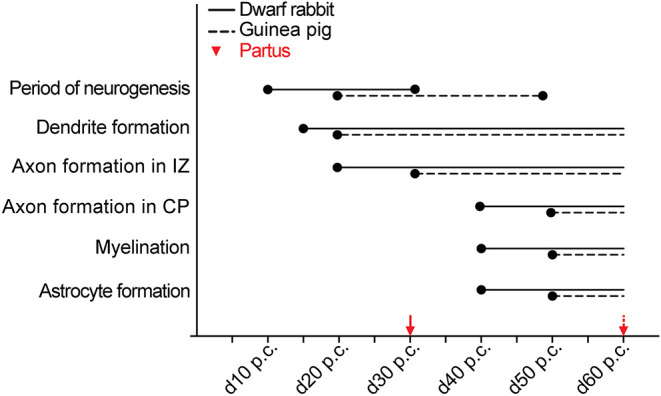
Mammals are born on a precocial-altricial continuum. Altricial species produce helpless neonates with closed distant organs incapable of locomotion, whereas precocial species give birth to well-developed young that possess sophisticated sensory and locomotor capabilities. Previous studies suggest that distinct patterns of cortex development differ between precocial and altricial species. This study compares patterns of neocortex neurogenesis and maturation in the precocial guinea pig and altricial dwarf rabbit, both belonging to the taxon of Glires. We show that the principal order of neurodevelopmental events is preserved in the neocortex of both species. Moreover, we show that neurogenesis starts at a later postconceptional day and takes longer in absolute gestational days in the precocial than the altricial neocortex. Intriguingly, our data indicate that the dwarf rabbit neocortex contains a higher abundance of highly proliferative basal progenitors than the guinea pig, which might underlie its higher encephalization quotient, demonstrating that the amount of neuron production is determined by complex regulation of multiple factors. Furthermore, we show that the guinea pig neocortex exhibits a higher maturation status at birth, thus providing evidence for the notions that precocial species might have acquired the morphological machinery required to attain their high functional state at birth and that brain expansion in the precocial newborn is mainly due to prenatally initiating processes of gliogenesis and neuron differentiation instead of increased neurogenesis. Together, this study reveals important insights into the timing and cellular differences that regulate mammalian brain growth and maturation and provides a better understanding of the evolution of mammalian altriciality and presociality.

Keywords: altricial; cortex development; dwarf rabbit; guinea pig; neurogenesis; neuron maturation; precocial.


Conflict of interest statement

The authors declare that the research was conducted in the absence of any commercial or financial relationships that could be construed as a potential conflict of interest.

Figures

Figure 1
Figure 1
Pax6 and Tbr2 expression in the germinal zones of the developing dwarf rabbit neocortex. (A–H) Double immunofluorescence for Pax6 (red) and Tbr2 (green) and DAPI staining (blue) on 30-μm cryosections of day 15 to 60 post-conception (p.c.) dwarf rabbit neocortex. The merge images show combined immunofluorescence for Pax6 and Tbr2. (A) The complete cortical wall is shown. (B–H) The top margin of the image corresponds to the transition zone SVZ/intermediate zone (B,C) or the intermediate zone (D–H). The dashed line indicates the border between VZ and SVZ. Scale bars, 50 μm. VZ, ventricular zone; SVZ, subventricular zone.
Figure 2
Figure 2
Pax6 and Tbr2 expression in the germinal zones of the developing guinea pig neocortex. (A–G) Double immunofluorescence for Pax6 (red) and Tbr2 (green) and DAPI staining (blue) on 30-μm cryosections of day 15 to 60 post-conception (p.c.) guinea pig neocortex. The merge images show combined immunofluorescence for Pax6 and Tbr2. (A–C) The complete cortical wall is shown. (D–G) The top margin of the image corresponds to the transition zone SVZ/intermediate zone (D) or the intermediate zone (E–G). Scale bars, 50 μm. The dashed line indicates the border between VZ and SVZ. VZ, ventricular zone; SVZ, subventricular zone.
Figure 3
Figure 3
Quantification of Pax6+/Tbr2–, Pax6+/Tbr2+, and Pax6–/Tbr2+ NPCs in the VZ and SVZ of the developing guinea pig and dwarf rabbit neocortex. (A–D) Pax6+/Tbr2– (red), Pax6+/Tbr2+ (red/green), and Pax6–/Tbr2+ (green) NPCs in the VZ (A,B) and SVZ (C,D) of day 15 to 60 post-conception (p.c.) dwarf rabbit (A,C) and guinea pig (B,D) neocortex, expressed as number of cells per 100 μm ventricular surface. Y-axis for (B) is shown in (A), y-axis for (D) is shown in (C). Color legend is shown in (A). For dwarf rabbits, the cortical wall corresponding to a total ventricular surface of 4.56–8.26 μm was analyzed. Data represent mean ± SD and are from two (d30 p.c., d35 p.c., d40 p.c., d50 p.c., d60 p.c.) or three (d15 p.c., d20 p.c., d25 p.c.) brains each. The cortical wall corresponding to a total ventricular surface of 2.70–13.68 μm was analyzed for the guinea pig. Data represent mean ± SD and are from two (d15 p.c., d20 p.c., d25 p.c.) or three (d31 p.c., d40 p.c., d50 p.c., d60 p.c.) brains each. Asterisks indicate statistically significant differences in Pax6+/Tbr2+ NPCs, Pax6+/Tbr2–, and Pax6–/Tbr2+ NPCs between corresponding neurogenesis stages of the dwarf rabbit and guinea pig, ***p < 0.001; **p < 0.01; *p < 0.05. Corresponding cortical neurogenesis stages were determined according to Workman et al. (2013) (www.translatingtime.org). For details, see the Materials and Methods section. Cell counts on a yellow background are significantly higher in the dwarf rabbit when compared with the guinea pig.
Figure 4
Figure 4
Extrapolation of NPCs abundance in the VZ and SVZ of the developing guinea pig and dwarf rabbit neocortex. (A,B) Pax6+/Tbr2– (red circles), Pax6–/Tbr2+ (green triangles), and Pax6+/Tbr2+ (blue rectangles) NPCs in the VZ of day 15 to 60 post conception (p.c.) dwarf rabbit and guinea pig neocortex, expressed as number of cells per 100 μm ventricular surface. Color legend is shown in (A). (C,D) Pax6+/Tbr2– (red circles) and Tbr2+ (Pax6–/Tbr2+, Pax6+/Tbr2+, green rectangles) NPCs in the VZ of day 15 to 60 post conception (p.c.) dwarf rabbit and guinea pig neocortex, expressed as number of cells per 100 μm ventricular surface. Color legend is shown in (C). (E,F) Pax6+/Tbr2– (red circles), Pax6–/Tbr2+ (green triangles), and Pax6+/Tbr2+ (blue rectangles) NPCs in the SVZ of day 15 to 60 post conception (p.c.) dwarf rabbit and guinea pig neocortex, expressed as number of cells per 100 μm ventricular surface. Color legend is shown in (A). (G,H) Pax6+/Tbr2– (red circles) and Tbr2+ (Pax6–/Tbr2+, Pax6+/Tbr2+, green rectangles) NPCs in the SVZ of day 15 to 60 post conception (p.c.) dwarf rabbit and guinea pig neocortex, expressed as number of cells per 100 μm ventricular surface. Color legend is shown in (C). (A–H) Data were obtained as in Figure 3. Development of NPCs in the VZ and SVZ was extrapolated based on Gaussian distribution. For details, see Materials and Methods section. (A) red line, R2 = 0.8964; green line, R2 = 0.6911; blue line, R2 = 0.9572; (B) red line, R2 = 0.8849; green line, R2 = 0.6944; blue line, R2 = 0.7487; (C) red line, R2 = 0.8964; green line, R2 = 0.9424; (D) red line, R2 = 0.8893; green line, R2 = 0.5212; (E) red line, R2 = 0.5694; green line, R2 = 0.7891; blue line, R2 = 0.9844; (F) red line, R2 = 0.9426; green line, R2 = 0.9190; blue line, R2 = 0.8249; (G) red line, R2 = 0.5694; green line, R2 = 0.9868; (H) red line, R2 = 0.9398; green line, R2 = 0.7716.
Figure 5
Figure 5
Tbr1 expression in the developing dwarf rabbit and guinea pig neocortex. (A–G) Immunofluorescence for Tbr1 (red) and DAPI staining (blue) on 30-μm cryosections of day 15 to 60 post-conception (p.c.) dwarf rabbit neocortex. (H) Quantification of CP thickness of d15–60 p.c. dwarf rabbit (light gray) and guinea pig (dark gray) neocortex. Data represent mean ± SD and are from two brains each. The asterisk indicates a statistically significant difference in CP thickness between corresponding neurogenesis stages of the dwarf rabbit and guinea pig, *p < 0.05. (I–O) Immunofluorescence for Tbr1 (red) and DAPI staining (blue) on 30-μm cryosections of day 15–60 p.c. guinea pig neocortex. (A–G,I–O) Scale bars, 50 μm. CP, cortical plate. DL, deep layer. UL, upper layer.
Figure 6
Figure 6
Hu C/D and Map2 expression in the developing dwarf rabbit and guinea pig neocortex. (A–N) Double immunofluorescence for Hu C/D (red, A–N) and Map2 (green, A–N) and DAPI staining (blue, C–G,J–N) on 30-μm cryosections of day 15 to 40 post-conception (p.c.) dwarf rabbit (A–G) and guinea pig (J–N) neocortex. Images in (A,B,H,I) show neurons with Hu C/D+ soma (open arrowhead) and extending Map2+ dendrites (solid arrowhead) in higher magnification of d40 p.c. dwarf rabbit (A,B) neocortex and d60 p.c. guinea pig (H,I) neocortex. Merge images in (A,B,H,I) show combined immunofluorescence of Hu C/D and Map2. CP, cortical plate. Scale bars, 10 μm (A,B,H,I) or 50 μm (C–G,J–N).
Figure 7
Figure 7
Hu C/D and Map2 expression in the developing dwarf rabbit and guinea pig neocortex. (A–D) Double immunofluorescence for Hu C/D (red) and Map2 (green) and DAPI staining (blue) on 30-μm cryosections of day 50 and 60 post-conception (p.c.) dwarf rabbit (A,B) and guinea pig (C,D) neocortex. Scale bars, 50 μm. CP, cortical plate. (E) Quantification of Hu C/D+ cells in d15–50 p.c. dwarf rabbit (light gray) and d20–60 p.c. guinea pig (dark gray) cortical wall, expressed as the number of cells per 100 μm ventricular surface. The cortical wall corresponding to a total ventricular surface of 3.86–6.02 μm (guinea pig) and 3.08–6.05 μm (dwarf rabbit) was analyzed. Data are from one brain each.
Figure 8
Figure 8
Neurofilament H and MBP expression in the developing dwarf rabbit and guinea pig neocortex. (A–J) Double immunofluorescence for neurofilament H (NF, red, A–J) and MBP (green, A–J) and DAPI staining (blue, B–E,G–J) on 30-μm cryosections of day 15–35 post-conception (p.c.) dwarf rabbit neocortex and d15–31 p.c. guinea pig neocortex. Images in (A,F) show NF+ extension (solid arrowhead) surrounded by MBP+ myelin sheath in higher magnification of d50 p.c. dwarf rabbit neocortex (A) and d60 p.c. guinea pig neocortex (F). Merge images in (A,F) show combined immunofluorescence of NF and MBP. CP, cortical plate. GZ, germinal zone. IZ, intermediate zone. Scale bars, 2 μm (A,F) or 50 μm (B–E,G–J).
Figure 9
Figure 9
Neurofilament H and MBP expression in the developing dwarf rabbit and guinea pig neocortex. (A–F) Double immunofluorescence for neurofilament H (NF, red) and MBP (green) and DAPI staining (blue) on 30-μm cryosections of day 40–60 post-conception (p.c.) dwarf rabbit (A–C) and guinea pig (D–F) neocortex. CP, cortical plate. Scale bars, 50 μm.
Figure 10
Figure 10
GFAP expression in the developing dwarf rabbit neocortex and guinea pig neocortex. (A–K) Immunofluorescence for GFAP (red) and DAPI staining (blue) on 30-μm cryosections of day 15–35 post-conception (p.c.) dwarf rabbit (A–F) and d15-31 p.c. guinea pig (G–K) neocortex. Images in (A,G) show GFAP+ astrocyte with soma and extending processes (solid arrowhead) in higher magnification of d60 p.c. dwarf rabbit (A) and d60 p.c. guinea pig (F) neocortex. Merge images in (A,G) show combined fluorescence of GFAP and DAPI. CP, cortical plate. GZ, germinal zone. IZ, intermediate zone. Scale bars, 10 μm (A,G) and 50 μm (B–F,H–K).
Figure 11
Figure 11
GFAP expression in the developing dwarf rabbit neocortex and guinea pig neocortex. Immunofluorescence for GFAP (red) and DAPI staining (blue) on 30-μm cryosections of day 40–60 post-conception (d p.c.) dwarf rabbit (A–C) neocortex and guinea pig (D–F) neocortex. CP, cortical plate. GZ, germinal zone. IZ, intermediate zone. Scale bars, 50 μm.
Figure 12
Figure 12
Comparison of specific neurodevelopmental events between the dwarf rabbit and guinea pig neocortex. Onset and duration of the period of neurogenesis, dendrite formation, axon formation, myelination, and astrocyte formation in the dwarf rabbit and guinea pig neocortex between day 10 and 60 post-conception (p.c.). Data for the period of neurogenesis are based on the development of Tbr2+ NPCs in the SVZ (Figure 4); data for dendrite formation, axon formation, myelination, and astrocyte formation are based on immunofluorescence staining (Figures 6–11). For details, see the Results section. Data for dwarf rabbits are shown in solid black lines, data for guinea pigs are shown in black dashed lines. Red arrows indicate the respective time of birth (partus) of the dwarf rabbit (solid line) and guinea pig (dashed line). IZ, intermediate zone. CP, cortical plate.

Similar articles

Cited by

References

    1. Aaku-Saraste E., Oback B., Hellwig A., Huttner W. B. (1997). Neuroepithelial cells downregulate their plasma membrane polarity prior to neural tube closure and neurogenesis. Mech. Dev. 69, 71–81. 10.1016/S0925-4773(97)00156-1 - DOI - PubMed
    1. Angevine J. B., Jr., Sidman R. L. (1961). Autoradiographic study of cell migration during histogenesis of cerebral cortex in the mouse. Nature 192, 766–768. 10.1038/192766b0 - DOI - PubMed
    1. Asher M., De Oliveira E. S., Sachser N. (2004). Social system and spatial organization of wild guinea pigs (Cavia aperea) in a natural population. J. Mammal. 85, 788–796. 10.1644/BNS-012 - DOI
    1. Attardo A., Calegari F., Haubensak W., Wilsch-Brauninger M., Huttner W. B. (2008). Live imaging at the onset of cortical neurogenesis reveals differential appearance of the neuronal phenotype in apical versus basal progenitor progeny. PLoS ONE 3:e2388. 10.1371/journal.pone.0002388 - DOI - PMC - PubMed
    1. Barami K., Iversen K., Furneaux H., Goldman S. A. (1995). Hu protein as an early marker of neuronal phenotypic differentiation by subependymal zone cells of the adult songbird forebrain. J. Neurobiol. 28, 82–101. 10.1002/neu.480280108 - DOI - PubMed

LinkOut - more resources