TLR1/2 Agonist Enhances Reversal of HIV-1 Latency and Promotes NK Cell-Induced Suppression of HIV-1-Infected Autologous CD4+ T Cells
- PMID: 34133900
- PMCID: PMC8354220
- DOI: 10.1128/JVI.00816-21
TLR1/2 Agonist Enhances Reversal of HIV-1 Latency and Promotes NK Cell-Induced Suppression of HIV-1-Infected Autologous CD4+ T Cells
Abstract
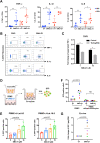
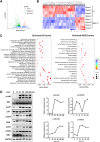
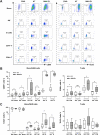
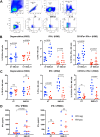
The complete eradication of human immunodeficiency virus type 1 (HIV-1) is blocked by latent reservoirs in CD4+ T cells and myeloid lineage cells. Toll-like receptors (TLRs) can induce the reversal of HIV-1 latency and trigger the innate immune response. To the best of our knowledge, there is little evidence showing the "killing" effect of TLR1/2 agonists but only a small "shock" potential. To identify a new approach for eradicating the HIV latent reservoir, we evaluated the effectiveness of SMU-Z1, a novel small-molecule TLR1/2 agonist, in the "shock-and-kill" strategy. The results showed that SMU-Z1 could enhance latent HIV-1 transcription not only ex vivo in peripheral blood mononuclear cells from aviremic HIV-1-infected donors receiving combined antiretroviral therapy but also in vitro in cells of myeloid-monocytic origin targeting the NF-κB and mitogen-activated protein kinase pathways. Interestingly, the activation marker CD69 was significantly upregulated in natural killer (NK) cells, B cells, and monocytes 48 h after SMU-Z1 treatment. Furthermore, SMU-Z1 was able to activate T cells without global T cell activation, as well as increasing NK cell degranulation and gamma interferon (IFN-γ) production, which further block HIV-1-infected CD4+ lymphocytes. In summary, the present study found that SMU-Z1 can both enhance HIV-1 transcription and promote NK cell-mediated inhibition of HIV-1-infected autologous CD4+ T cells. These findings indicate that the novel TLR1/2 agonist SMU-Z1 is a promising latency-reversing agent (LRA) for eradication of HIV-1 reservoirs. IMPORTANCE Multiple in vivo studies showed that many LRAs used in the shock-and-kill approach could activate viral transcription but could not induce killing effectively. Therefore, a dual-function LRA is needed for elimination of HIV-1 reservoirs. We previously developed a small-molecule TLR1/2 agonist, SMU-Z1, and demonstrated that it could upregulate NK cells and CD8+ T cells with immune adjuvant and antitumor properties in vivo. In the present study, SMU-Z1 could activate innate immune cells without global T cell activation, induce production of proinflammatory and antiviral cytokines, and enhance the cytotoxic function of NK cells. We showed that SMU-Z1 displayed dual potential ex vivo in the shock of exposure of latently HIV-1-infected cells and in the kill of clearance of infected cells, which is critical for effective use in combination with therapeutic vaccines or broadly neutralizing antibody treatments aimed at curing AIDS.
Keywords: HIV-1 reservoirs; NK cells; TLR2; latency-reversing agents; shock and kill.
Figures

Similar articles
-
A Novel Toll-Like Receptor 9 Agonist, MGN1703, Enhances HIV-1 Transcription and NK Cell-Mediated Inhibition of HIV-1-Infected Autologous CD4+ T Cells.J Virol. 2016 Apr 14;90(9):4441-4453. doi: 10.1128/JVI.00222-16. Print 2016 May. J Virol. 2016. PMID: 26889036 Free PMC article.
-
Interleukin-15-Stimulated Natural Killer Cells Clear HIV-1-Infected Cells following Latency Reversal Ex Vivo.J Virol. 2018 May 29;92(12):e00235-18. doi: 10.1128/JVI.00235-18. Print 2018 Jun 15. J Virol. 2018. PMID: 29593039 Free PMC article.
-
The HIV Latency Reversal Agent HODHBt Enhances NK Cell Effector and Memory-Like Functions by Increasing Interleukin-15-Mediated STAT Activation.J Virol. 2022 Aug 10;96(15):e0037222. doi: 10.1128/jvi.00372-22. Epub 2022 Jul 14. J Virol. 2022. PMID: 35867565 Free PMC article.
-
Targeting Cellular and Tissue HIV Reservoirs With Toll-Like Receptor Agonists.Front Immunol. 2019 Oct 15;10:2450. doi: 10.3389/fimmu.2019.02450. eCollection 2019. Front Immunol. 2019. PMID: 31681325 Free PMC article. Review.
-
Potential of the NKG2D/NKG2DL Axis in NK Cell-Mediated Clearance of the HIV-1 Reservoir.Int J Mol Sci. 2019 Sep 11;20(18):4490. doi: 10.3390/ijms20184490. Int J Mol Sci. 2019. PMID: 31514330 Free PMC article. Review.
Cited by
-
Toll-like Receptor Mediation in SARS-CoV-2: A Therapeutic Approach.Int J Mol Sci. 2022 Sep 14;23(18):10716. doi: 10.3390/ijms231810716. Int J Mol Sci. 2022. PMID: 36142620 Free PMC article. Review.
-
Advances in HIV-1-specific chimeric antigen receptor cells to target the HIV-1 reservoir.J Virus Erad. 2022 Jun 18;8(2):100073. doi: 10.1016/j.jve.2022.100073. eCollection 2022 Jun. J Virus Erad. 2022. PMID: 35784676 Free PMC article.
-
Triptoquinone A and B exercise a therapeutic effect in systemic lupus erythematosus by regulating NLRC3.PeerJ. 2023 Jun 9;11:e15395. doi: 10.7717/peerj.15395. eCollection 2023. PeerJ. 2023. PMID: 37312878 Free PMC article.
-
Medicinal Chemistry of Anti-HIV-1 Latency Chemotherapeutics: Biotargets, Binding Modes and Structure-Activity Relationship Investigation.Molecules. 2022 Dec 20;28(1):3. doi: 10.3390/molecules28010003. Molecules. 2022. PMID: 36615199 Free PMC article. Review.
-
Role of TLRs in HIV-1 Infection and Potential of TLR Agonists in HIV-1 Vaccine Development and Treatment Strategies.Pathogens. 2023 Jan 5;12(1):92. doi: 10.3390/pathogens12010092. Pathogens. 2023. PMID: 36678440 Free PMC article. Review.
References
-
- Dai H, Lan P, Zhao D, Abou-Daya K, Liu W, Chen W, Friday AJ, Williams AL, Sun T, Chen J, Chen W, Mortin-Toth S, Danska JS, Wiebe C, Nickerson P, Li T, Mathews LR, Turnquist HR, Nicotra ML, Gingras S, Takayama E, Kubagawa H, Shlomchik MJ, Oberbarnscheidt MH, Li XC, Lakkis FG. 2020. PIRs mediate innate myeloid cell memory to nonself MHC molecules. Science 368:1122–1127. 10.1126/science.aax4040. - DOI - PMC - PubMed
Publication types
MeSH terms
Substances
Grants and funding
- 2018ZX10301101/MOST | National Science and Technology Infrastructure Program (National Key Science Projects Program)
- 81773787/National Natural Science Foundation of China (NSFC)
- 2018030312010/People's Government of Guangdong Province | National Natural Science Foundation of China-Guangdong Joint Fund (NSFC-Guangdong Joint Fund)
LinkOut - more resources
Full Text Sources
Medical
Research Materials

