Topography of Movement-Related Delta and Theta Brain Oscillations
- PMID: 34131823
- PMCID: PMC8384804
- DOI: 10.1007/s10548-021-00854-0
Topography of Movement-Related Delta and Theta Brain Oscillations
Abstract
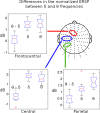
The aim of this study was to analyse the high density EEG during movement execution guided by visual attention to reveal the detailed topographic distributions of delta and theta oscillations. Twenty right-handed young subjects performed a finger tapping task, paced by a continuously transited repeating visual stimuli. Baseline corrected power of scalp current density transformed EEG was statistically assessed with cluster-based permutation testing. Delta and theta activities revealed differences in their spatial properties at the time of finger tapping execution. Theta synchronization showed a contralateral double activation in the parietal and fronto-central regions, while delta activity appeared in the central contralateral channels. Differences in the spatiotemporal topography between delta and theta activity in the course of movement execution were identified on high density EEG.
Keywords: Delta oscillations; EEG power dynamics; Event-related synchronization; Finger tapping; Scalp current density; Theta oscillations.
© 2021. The Author(s).
Conflict of interest statement
Authors have no conflicts of interests to declare.
Figures


Similar articles
-
Event-Related Spectral Perturbation, Inter Trial Coherence, and Functional Connectivity in motor execution: A comparative EEG study of old and young subjects.Brain Behav. 2023 Aug;13(8):e3176. doi: 10.1002/brb3.3176. Epub 2023 Jul 21. Brain Behav. 2023. PMID: 37624638 Free PMC article.
-
Movement-related phase locking in the delta-theta frequency band.Neuroimage. 2016 Oct 1;139:439-449. doi: 10.1016/j.neuroimage.2016.06.052. Epub 2016 Jun 29. Neuroimage. 2016. PMID: 27374370
-
Motor oscillations reveal new correlates of error processing in the human brain.Sci Rep. 2024 Mar 7;14(1):5624. doi: 10.1038/s41598-024-56223-x. Sci Rep. 2024. PMID: 38454108 Free PMC article.
-
Delta, theta, and alpha event-related oscillations in alcoholics during Go/NoGo task: Neurocognitive deficits in execution, inhibition, and attention processing.Prog Neuropsychopharmacol Biol Psychiatry. 2016 Feb 4;65:158-71. doi: 10.1016/j.pnpbp.2015.10.002. Epub 2015 Oct 9. Prog Neuropsychopharmacol Biol Psychiatry. 2016. PMID: 26456730 Free PMC article.
-
EEG alpha and theta oscillations reflect cognitive and memory performance: a review and analysis.Brain Res Brain Res Rev. 1999 Apr;29(2-3):169-95. doi: 10.1016/s0165-0173(98)00056-3. Brain Res Brain Res Rev. 1999. PMID: 10209231 Review.
Cited by
-
Impact of age-related hearing loss on decompensation of left DLPFC during speech perception in noise: a combined EEG-fNIRS study.Geroscience. 2024 Oct 24. doi: 10.1007/s11357-024-01393-9. Online ahead of print. Geroscience. 2024. PMID: 39446223
-
Local field potentials and single unit dynamics in motor cortex of unconstrained macaques during different behavioral states.Front Neurosci. 2023 Nov 23;17:1273627. doi: 10.3389/fnins.2023.1273627. eCollection 2023. Front Neurosci. 2023. PMID: 38075283 Free PMC article.
-
Neurophysiological Oscillatory Mechanisms Underlying the Effect of Mirror Visual Feedback-Induced Illusion of Hand Movements on Nociception and Cortical Activation.Brain Sci. 2024 Jul 12;14(7):696. doi: 10.3390/brainsci14070696. Brain Sci. 2024. PMID: 39061436 Free PMC article.
-
Electroencephalographic Effective Connectivity Analysis of the Neural Networks during Gesture and Speech Production Planning in Young Adults.Brain Sci. 2023 Jan 4;13(1):100. doi: 10.3390/brainsci13010100. Brain Sci. 2023. PMID: 36672081 Free PMC article.
-
Event-Related Spectral Perturbation, Inter Trial Coherence, and Functional Connectivity in motor execution: A comparative EEG study of old and young subjects.Brain Behav. 2023 Aug;13(8):e3176. doi: 10.1002/brb3.3176. Epub 2023 Jul 21. Brain Behav. 2023. PMID: 37624638 Free PMC article.
References
-
- Brunia C, Van Boxtel G, Böcker K. Negative slow waves as indices of anticipation: the bereitschaftspotential, the contingent negative variation, and the stimulus-preceding negativity. The Oxford Handbook of Event-Related Potential Components. 2012 doi: 10.1093/oxfordhb/9780195374148.013.0108. - DOI
Publication types
MeSH terms
LinkOut - more resources
Full Text Sources

