

Long-term effects of somatostatin analogues in rat GH-secreting pituitary tumor cell lines
- PMID: 34128215
- PMCID: PMC8741688
- DOI: 10.1007/s40618-021-01609-1
Long-term effects of somatostatin analogues in rat GH-secreting pituitary tumor cell lines
Abstract
Purpose: First-generation somatostatin analogs, octreotide (OCT) and lanreotide, are the cornerstone for the medical treatment of growth hormone (GH)-secreting pituitary tumors. A new multireceptor analog, such as pasireotide (PAS), showed better activity than OCT in long-term treatment of patients with acromegaly, but modulation of intracellular key processes is still unclear in vitro. In this study, we evaluated the antitumor activity of OCT and PAS in two GH-secreting pituitary tumor cell lines, GH3 and GH4C1, after a long-term incubation.
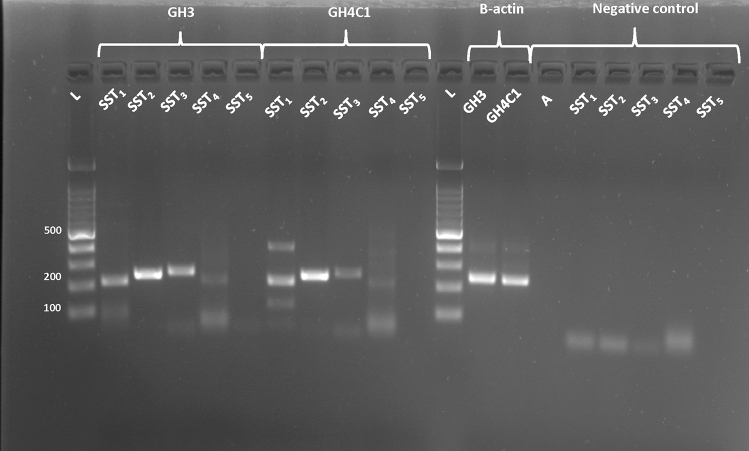
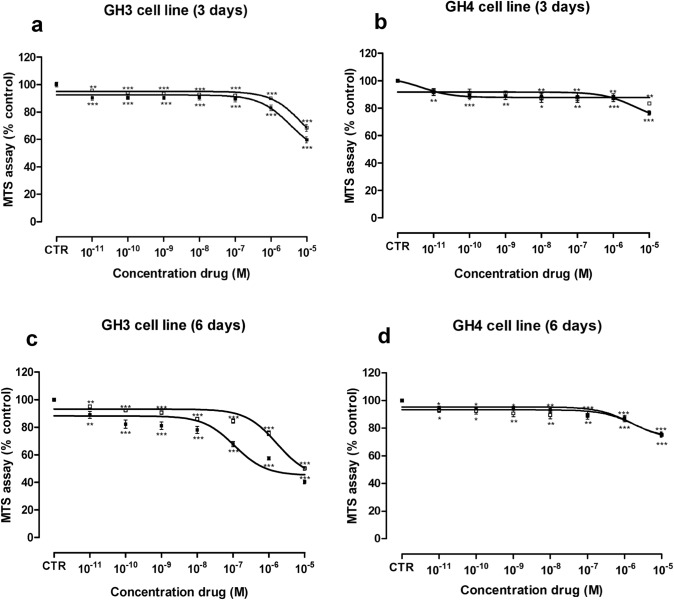
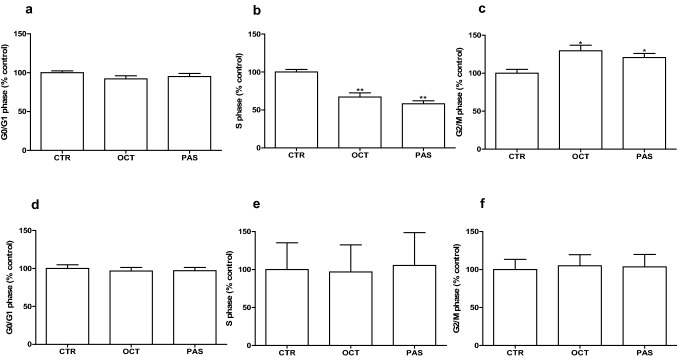
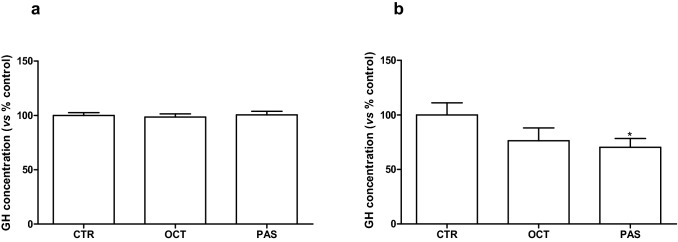
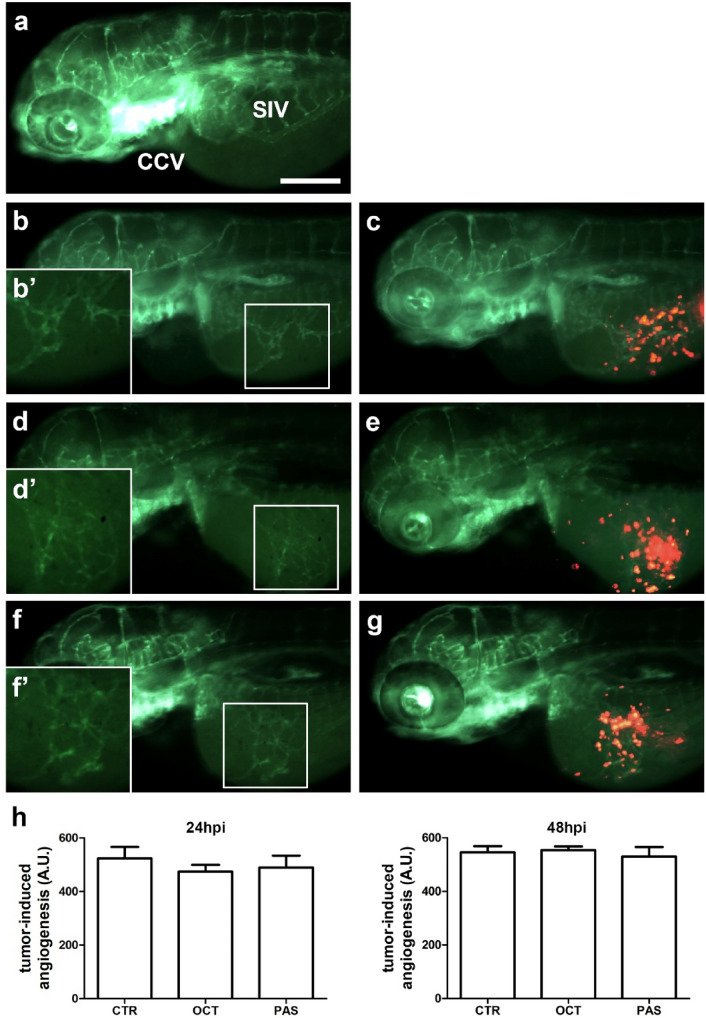
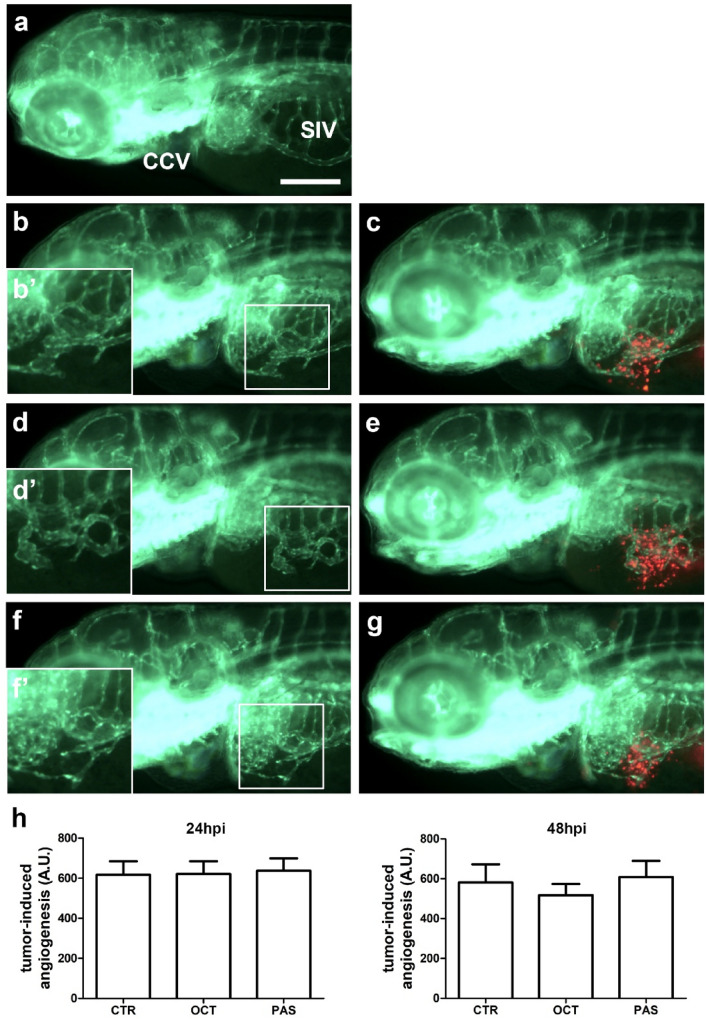
Methods: The effects of PAS and OCT on the cell viability, cell cycle, apoptosis, GH secretion, and tumor-induced angiogenesis have been evaluated through a colorimetric method (MTS Assay), DNA flow cytometry with propidium iodide, and Annexin V-FITC/propidium iodide staining, ELISA assay and zebrafish platform, respectively.
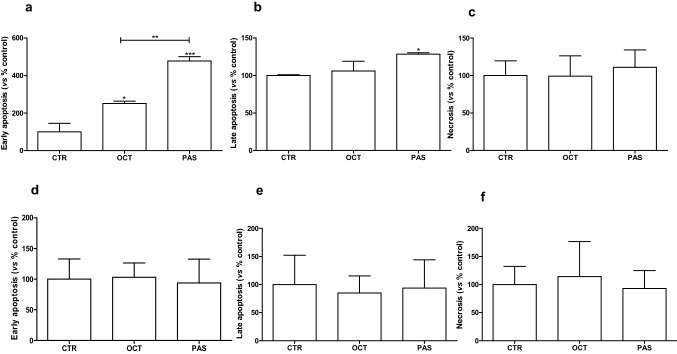
Results: PAS showed a more potent antitumor activity compared to OCT in GH3 cell line exerted through inhibition of cell viability, perturbation of cell cycle progression, and induction of apoptosis after 6 days of incubation. A concomitant decrease in GH secretion has been observed after 2 days of incubation only with PAS. No effect on tumor-induced angiogenesis has been reported after treatment with OCT or PAS in zebrafish/tumor xenograft model.
Conclusion: Long-term incubation with PAS showed a more potent antitumor activity than that reported after OCT in GH3 cells, mainly modulated by a cell cycle perturbation and a relevant induction in apoptosis.
Keywords: Acromegaly; Apoptosis; GH-secreting pituitary tumor; Long-term treatment; Somatostatin analogs.
© 2021. The Author(s).
Conflict of interest statement
The authors declare that they have no conflict of interest.
Figures
Similar articles
-
In Vitro Head-to-Head Comparison Between Octreotide and Pasireotide in GH-Secreting Pituitary Adenomas.J Clin Endocrinol Metab. 2017 Jun 1;102(6):2009-2018. doi: 10.1210/jc.2017-00135. J Clin Endocrinol Metab. 2017. PMID: 28323931
-
Lanreotide promotes apoptosis and is not radioprotective in GH3 cells.Endocr Relat Cancer. 2009 Sep;16(3):1045-55. doi: 10.1677/ERC-09-0003. Epub 2009 Jun 15. Endocr Relat Cancer. 2009. PMID: 19528243
-
The effects of somatostatin analogue therapy on pituitary tumor volume in patients with acromegaly.Pituitary. 2016 Apr;19(2):210-21. doi: 10.1007/s11102-015-0677-y. Pituitary. 2016. PMID: 26290466 Free PMC article. Review.
-
Relative potencies of the somatostatin analogs octreotide, BIM-23014, and RC-160 on the inhibition of hormone release by cultured human endocrine tumor cells and normal rat anterior pituitary cells.Endocrinology. 1994 Jan;134(1):301-6. doi: 10.1210/endo.134.1.7903931. Endocrinology. 1994. PMID: 7903931
-
Medical therapy of acromegaly: efficacy and safety of somatostatin analogues.Drugs. 2009 Nov 12;69(16):2207-26. doi: 10.2165/11318510-000000000-00000. Drugs. 2009. PMID: 19852525 Review.
Cited by
-
Exploration of the Effects of TGF-β Pathway-Based Pituitary Tumor of Rats on GH3 Cell Line after Intervention with Different Concentrations of TGZ.Contrast Media Mol Imaging. 2022 Aug 17;2022:7445042. doi: 10.1155/2022/7445042. eCollection 2022. Contrast Media Mol Imaging. 2022. Retraction in: Contrast Media Mol Imaging. 2023 Aug 30;2023:9769474. doi: 10.1155/2023/9769474. PMID: 36072638 Free PMC article. Retracted.
-
Antitumor Activity of Axitinib in Lung Carcinoids: A Preclinical Study.Cancers (Basel). 2023 Nov 12;15(22):5375. doi: 10.3390/cancers15225375. Cancers (Basel). 2023. PMID: 38001635 Free PMC article.
-
Carcinoid Syndrome: Preclinical Models and Future Therapeutic Strategies.Int J Mol Sci. 2023 Feb 10;24(4):3610. doi: 10.3390/ijms24043610. Int J Mol Sci. 2023. PMID: 36835022 Free PMC article. Review.
-
Preoperative medical treatments and surgical approaches for acromegaly: A systematic review.Clin Endocrinol (Oxf). 2023 Jan;98(1):14-31. doi: 10.1111/cen.14790. Epub 2022 Jun 30. Clin Endocrinol (Oxf). 2023. PMID: 35726150 Free PMC article. Review.
-
PER2 integrates circadian disruption and pituitary tumorigenesis.Theranostics. 2023 Apr 29;13(8):2657-2672. doi: 10.7150/thno.82995. eCollection 2023. Theranostics. 2023. PMID: 37215573 Free PMC article.
