Multicenter Study
. 2021 May 27:12:661551.
doi: 10.3389/fimmu.2021.661551. eCollection 2021.

Association of Premature Immune Aging and Cytomegalovirus After Solid Organ Transplant

Affiliations
Multicenter Study

Association of Premature Immune Aging and Cytomegalovirus After Solid Organ Transplant

Lauren E Higdon et al. Front Immunol. .

Abstract

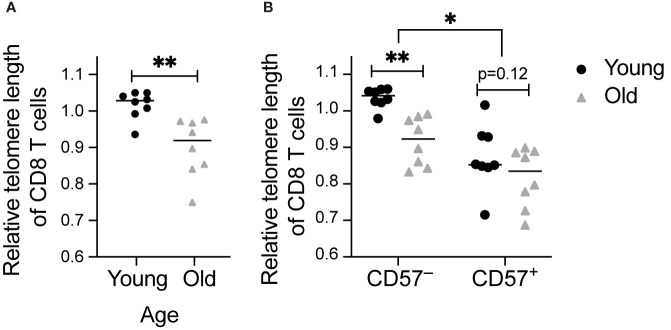
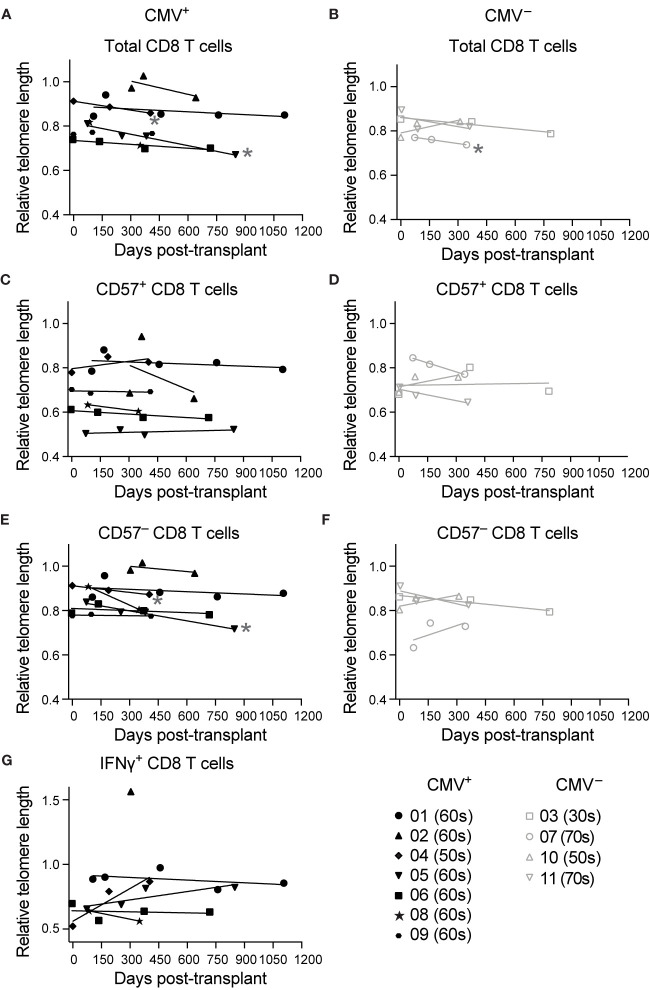
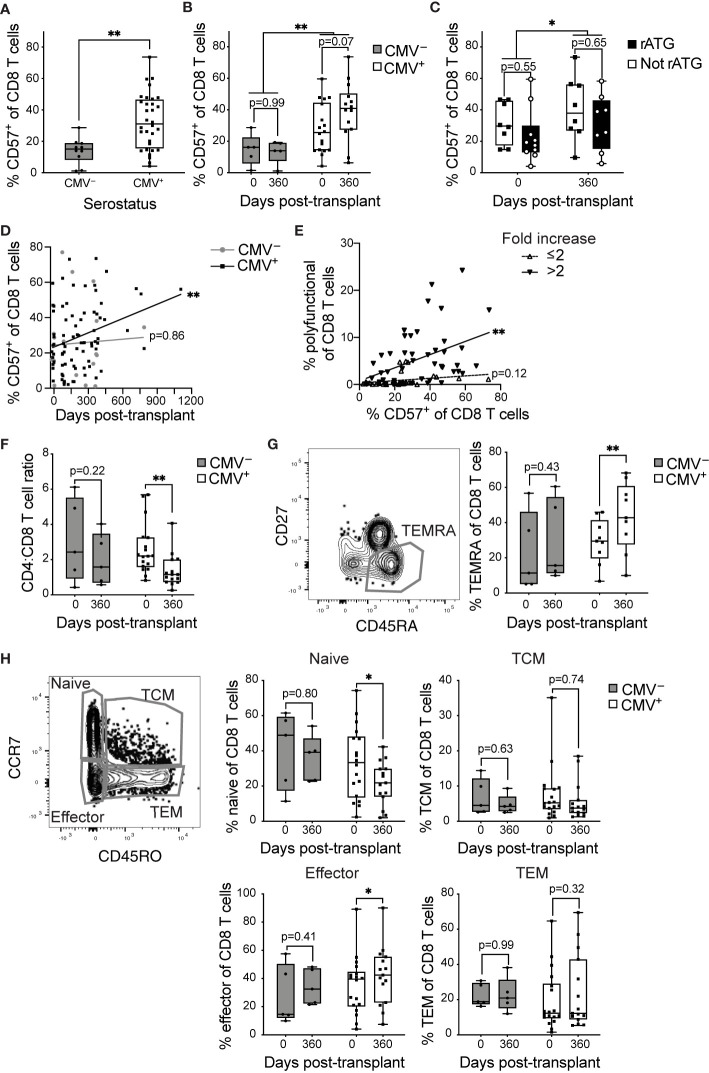
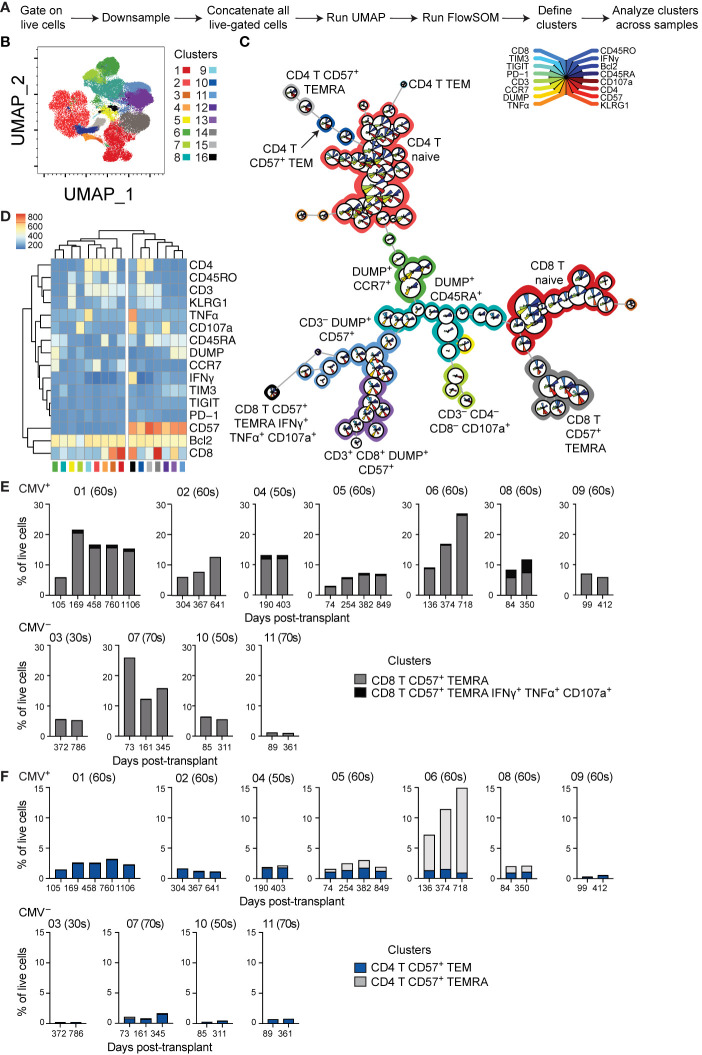
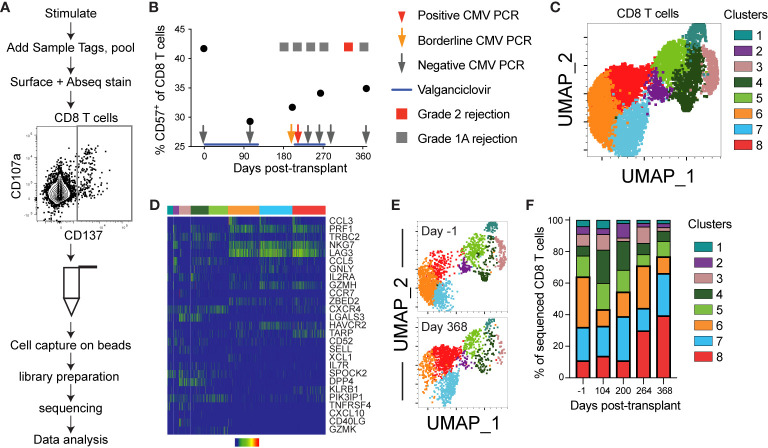
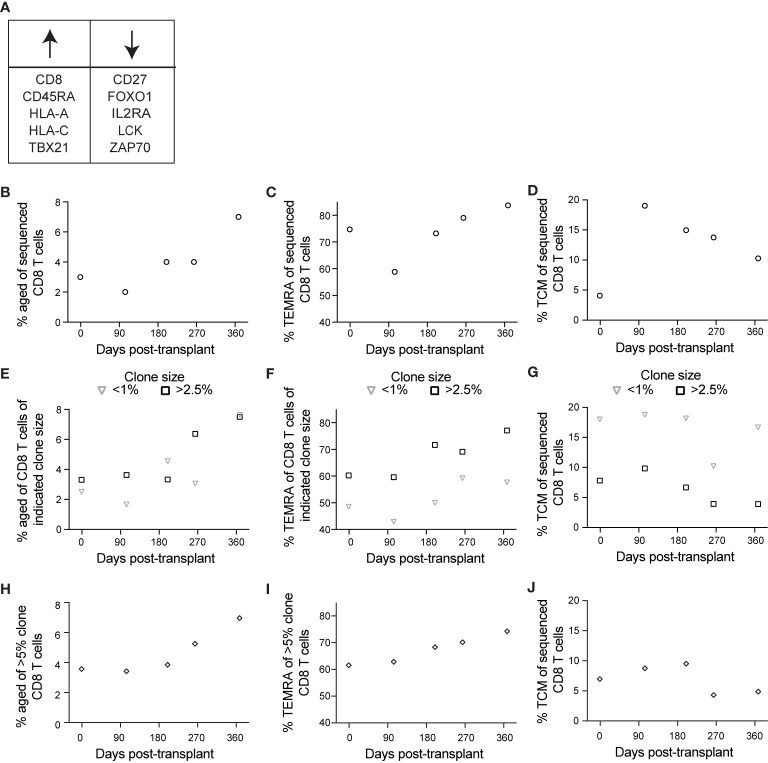
Immune function is altered with increasing age. Infection with cytomegalovirus (CMV) accelerates age-related immunological changes resulting in expanded oligoclonal memory CD8 T cell populations with impaired proliferation, signaling, and cytokine production. As a consequence, elderly CMV seropositive (CMV+) individuals have increased mortality and impaired responses to other infections in comparison to seronegative (CMV-) individuals of the same age. CMV is also a significant complication after organ transplantation, and recent studies have shown that CMV-associated expansion of memory T cells is accelerated after transplantation. Thus, we investigated whether immune aging is accelerated post-transplant, using a combination of telomere length, flow cytometry phenotyping, and single cell RNA sequencing. Telomere length decreased slightly in the first year after transplantation in a subset of both CMV+ and CMV- recipients with a strong concordance between CD57+ cells and short telomeres. Phenotypically aged cells increased post-transplant specifically in CMV+ recipients, and clonally expanded T cells were enriched for terminally differentiated cells post-transplant. Overall, these findings demonstrate a pattern of accelerated aging of the CD8 T cell compartment in CMV+ transplant recipients.

Keywords: Telomere; cytomegalovirus (CMV); flow cytometry; immunosenescence; transplantation immunobiology.


Conflict of interest statement

JSM has a family member who is employed by and has an equity interest in Genentech/Roche. No patents have been filed pertaining to the results presented in this paper. The remaining authors declare that the research was conducted in the absence of any commercial or financial relationships that could be construed as a potential conflict of interest.

Figures

Figure 1
Figure 1
Telomere length decreases with age and in CD57+ CD8 T cells: Telomere length was calculated by subtraction of value without telomere probe added ( Supplementary Figure 1C ) and normalization to value for live cells from a healthy volunteer. Measurements were completed in CD8 T cells from young (18-35 years old) and old (60-80+ years old) healthy individuals. Comparison of telomere length of (A) total and (B) CD57+ and CD57 CD8 T cells between age groups. Dots represent individual samples and lines represent medians. Statistics were (A) Mann-Whitney test or (B) two-way ANOVA. *p < 0.05, **p < 0.01. n = 8 per group.
Figure 2
Figure 2
Telomere length decreases in total CD8 T cells post-transplant in a subset of subjects: Samples were stimulated for 6 hrs with IE-1 and pp65. Relative telomere length was calculated as described in the legend of Figure 1 . Values were calculated for (A, B) total CD8 T cells, (C, D) CD57+ CD8 T cells, (E, F) CD57 CD8 T cells, and (G) IFNγ+ CD8 T cells for (A, C, E, G) CMV+ and (B, D, F) CMV recipients. Dots represent individual samples and lines represent simple linear regressions. In the key at lower right, number indicates subject ID, and parenthetical number indicates subject age decade on day of transplant. * indicates statistically significant slope (p<0.05) of indicated regression. n = 7 (CMV+) or 4 (CMV) subjects.
Figure 3
Figure 3
CD8 T cells become phenotypically aged in CMV+ transplant recipients: T cells from CMV+ and CMV transplant recipients were analyzed by flow cytometry. % CD57+ was measured at (A) combined time points (B) pre-transplant versus one year post-transplant. (C) % CD57+ of CD8 T cells pre-transplant versus one year post-transplant with CMV+ recipients grouped based on induction therapy. (D) % CD57+ of CD8 T cells plotted versus time. (E) % CD57+ plotted versus % polyfunctional (a measure of memory inflation) for CMV+ recipients. Polyfunctionality was defined with Boolean gating as in Supplementary Figure 2B and (21). The data are divided based on the magnitude of inflation, as fold change >2 or ≤2. (F) Ratio of proportion of CD4 to CD8 T cells. (G) Representative gating of CD45RA+CD27 TEMRA (left). TEMRA population was defined as CD45RA+CD27 or CD45RA+CCR7CD45RO and proportion TEMRA of CD8 T cells determined (right). (H) Naive, memory, and effector populations defined based on CCR7 and CD45RO (left). Proportion of CD8 T cells belonging to naive (top middle), TCM (top right), effector (bottom middle), and TEM (bottom right) determined. (A–C, F–H) Dots represent individual samples and box and whisker plots represent the range from minimum to maximum. Statistics were (A) Mann-Whitney test, (B, C, F–H) mixed-effects analysis with Sidak correction for multiple comparisons, (D, E) simple linear regression (lines on graph) with p-values displayed at right. *p<0.05, **p<0.01. (A, B, F, H) n = 5-18 per group, (C) n= 8-10 per group, (D) n= 7-20 per group, (E) n = 20 (G) n= 5-9 per group.
Figure 4
Figure 4
Unbiased analysis identifies expansion of aged CD8 T cell population post-transplant: (A) Live-gated flow cytometric phenotypic data from eleven transplant recipients were downsampled to 11,500 cells each and compensated data concatenated. (B) Dimensions were reduced using UMAP. (C) FlowSOM was run to cluster the data and identify populations. (D) Heatmap generated by FlowSOM plug-in defines gene expression of each FlowSOM cluster. Clustering on the heatmap was unsupervised. The percentage of live cells represented by each CD57+ (E) CD8+ or (F) CD4+ cluster was calculated and graphed, with individual patients separated. (E, F) The number above each graph is the subject ID, and the parenthetical number the indicates subject age decade on day of transplant. CMV+ subjects listed on top, and CMV subjects listed on bottom. n= 7 (CMV+) or 4 (CMV) subjects.
Figure 5
Figure 5
Single cell sequencing reveals post-transplant CD8 T cell aging: CD8 T cells from one CMV+ heart transplant recipient (subject 14) from five time points encompassing pre- to one year post-transplant were sequenced using the BD Rhapsody system to detect V(D)J complementarity determining region (CDR)3, T cell associated gene expression, and surface expression of oligo-conjugated CD45RA. (A) Schematic of the experimental workflow, including sort gate for CD137+ IE-1-responsive T cells. (B) The percentage CD57+ of CD8 T cells was calculated from analysis of surface stain data from this subject from a prior experiment on aliquots of the same samples. Overlaid onto the graph are information about her course of antiviral prophylaxis (valganciclovir), CMV PCR testing, and rejection episodes. The positive CMV PCR (red arrow) was 213 international units/mL and the borderline CMV PCR (orange arrow) was detectable but below the 135 IU/mL limit of quantitation. The grade 1A rejection events were not treated, and the grade 2 rejection was treated by steroid. (C) The Seurat plug-in in SeqGeq was used to cluster all CD8 T cell data from this subject and project the clusters onto UMAP. (D) The three genes with the highest and lowest fold change in each cluster were determined, and a heatmap of expression levels created in SeqGeq. The order of genes in the heatmap is determined by expression level, with the most highly expressed genes on top. In some cases, the same gene was in the top or bottom three for multiple clusters, so the total number does not reflect six per cluster. Each bar in the heatmap represents an individual cell. (E) UMAP overlay of clusters at the first (day -1) and final (day 368) time points. (F) Frequencies represented by each cluster at each time point. n=1 subject.
Figure 6
Figure 6
Single cell sequencing reveals an association between aging and CD8 T cell clonality: BD Rhapsody analysis of subject 14 was completed as described in the legend to Figure 5 . (A) We identified aged cells in the sequencing data using sets of genes positively and negatively associated with immune aging. (B) Based on this definition, we determined frequency aged of CD8 T cells at each time point. (C) We determined percentage TEMRA, with TEMRA defined as CD45RA+CD27CCR7. (D) We determined percentage TCM, with TCM defined as CD45RACCR7+. We then calculated percentage (E) aged, (F) TEMRA, and (G) TCM of CD8 T cells of indicated clone sizes, with <1% representing small clones and >2.5% representing large clones. To specifically analyze the largest clones, we then calculated percentage (H) aged, (I) TEMRA, and (J) TCM of those clones represented by >5% of CD8 T cells at one or more time points, representing the largest clones. n=1 subject.

Similar articles

Cited by

References

    1. Gomez C, Nomellini V, Faunce DE, Kovacs EJ. Innate Immunity and Aging. Exp Gerontol (2008) 43(8):718–28. 10.1016/j.exger.2008.05.016 - DOI - PMC - PubMed
    1. Nikolich-Zugich J. The Twilight of Immunity: Emerging Concepts in Aging of the Immune System. Nat Immunol (2018) 19:10–9. 10.1038/s41590-017-0006-x - DOI - PubMed
    1. Goronzy JJ, Weyand CM. Mechanisms Underlying T Cell Ageing. Nat Rev Immunol (2019) 19(9):573–83. 10.1038/s41577-019-0180-1 - DOI - PMC - PubMed
    1. Jarvis MA, Nelson JA. Mechanisms of Human Cytomegalovirus Persistence and Latency. Front Biosci (2002) 7:d1575–82. 10.2741/jarvis - DOI - PubMed
    1. Karrer U, Sierro S, Wagner M, Oxenius A, Hengel H, Koszinowski UH, et al. . Memory Inflation: Continuous Accumulation of Antiviral CD8+ T Cells Over Time. J Immunol (2003) 170(4):2022–9. 10.4049/jimmunol.170.4.2022 - DOI - PubMed

Publication types

MeSH terms